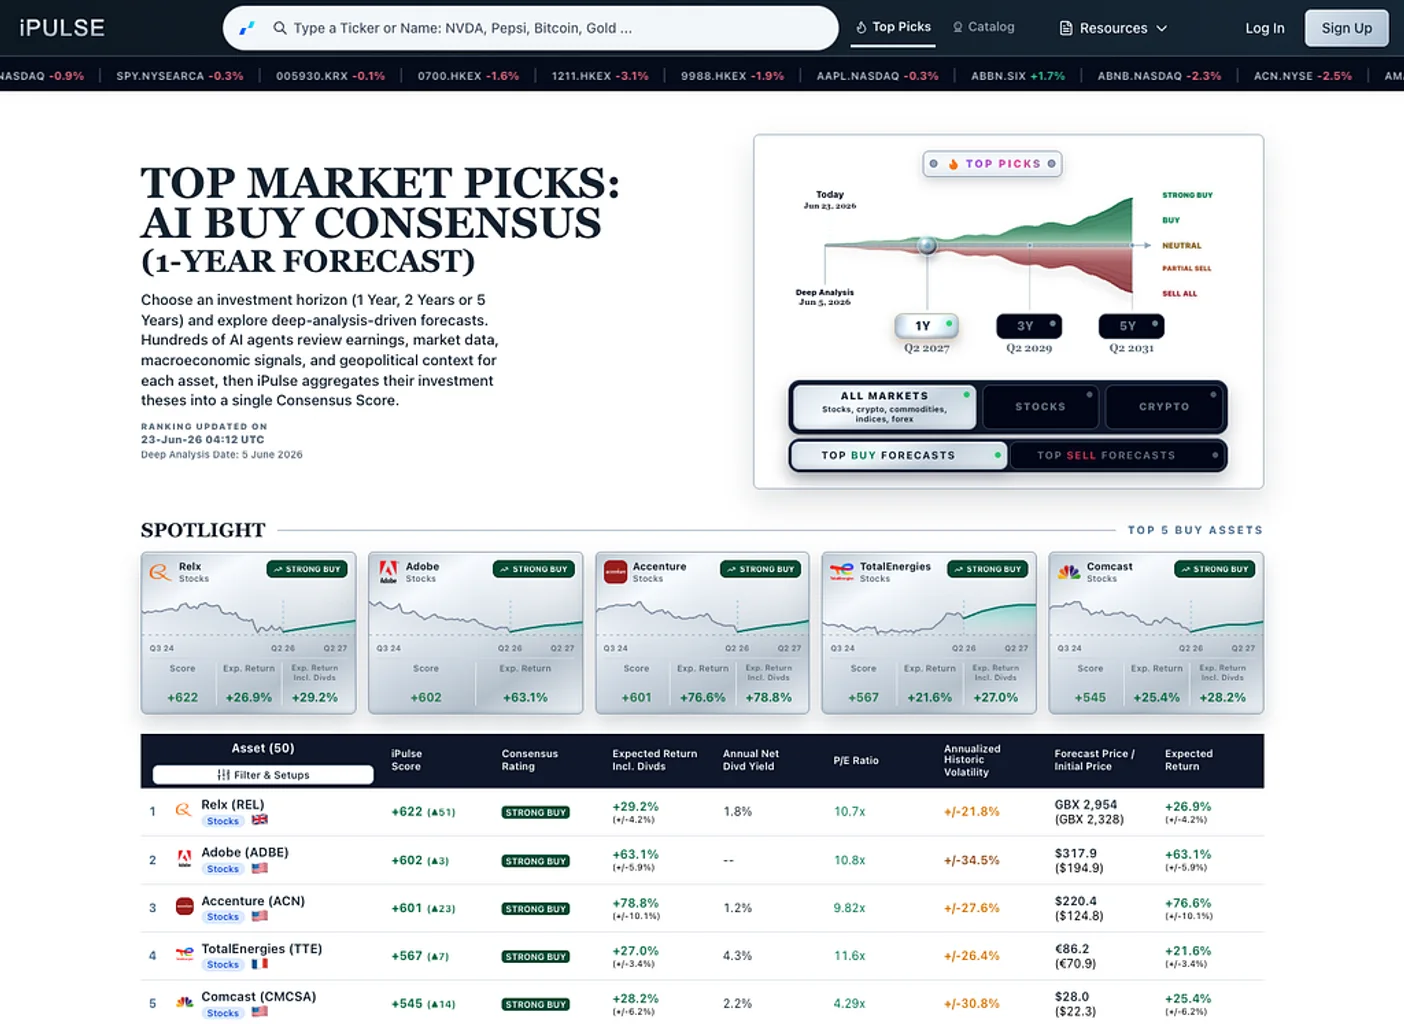
AI stock research tools can help investors find companies, examine financials and question an investment thesis. Choosing one starts with the research task: do you need to understand a business, compare a quantitative rating, examine an analyst's view or revisit a forecast made months ago?
Here are seven platforms to inspect: iPulse AI, Seeking Alpha, Zacks, TipRanks, The Motley Fool, StockInvest.us and InvestingPro. Fiscal.ai and TrendSpider are two additional alternatives worth considering for financial-document research and chart-based workflows. Their outputs have different meanings, so a useful comparison needs more than a list of features.
I put iPulse AI first for inspecting research assumptions and archived forecast editions. I am its founder, and this is an editorial selection published on our own site. The competitor descriptions come from official documentation reviewed on 3 October 2026; they are not a paid-account benchmark or evidence of superior investment returns. The ordering expresses the workflow I prioritize, rather than an independently tested overall ranking. Subscription features and access can change, so check the current plan before paying.
Comparing AI stock research tools by the question they answer
A research assistant can explain a filing. A quantitative system can summarize a stock's position against a peer group. An analyst can develop a long-term thesis. A forecast can describe a possible future outcome. Those are useful contributions, but a strong result in one category does not establish strength in the others.
The table below identifies a starting use case for each platform. The last column is a question to carry into your own inspection, not a finding that a provider has failed the test. The numbered entries that follow link the primary evidence behind these descriptions.
| Rank | Tool | Starting research task | What to inspect before relying on the output |
|---|---|---|---|
| 1 | iPulse AI | Examine research assumptions and archived scenario forecasts | Original edition, horizon, return basis and disagreement |
| 2 | Seeking Alpha | Examine quantitative ratings and AI reports | Underlying metrics, source support and rating history |
| 3 | Zacks | Understand earnings-estimate revision signals | Estimate changes behind the rank |
| 4 | TipRanks | Compare market signals and AI analysis | Which input supports each conclusion |
| 5 | The Motley Fool | Follow a long-term research thesis | Recommendation date, thesis updates and comparison basis |
| 6 | StockInvest.us | Combine technical signals and AI company analysis | Signal timeframe and supporting business evidence |
| 7 | InvestingPro / WarrenAI | Ask follow-up financial research questions | Data date, definitions and source support |
 1. iPulse AI: inspecting assumptions and past forecasts
iPulse AI is an Open Agentic Investment Research Platform. Here, open means making research, methodology, experiments, limitations and past forecasts inspectable; it does not mean every part of our production system or dataset is open source.
Its Forecast Library provides a way to examine archived forecasts, while the consensus methodology explains how multiple advisor perspectives contribute to the output. This is the workflow I value most: preserve what the system originally said, inspect the assumptions and disagreement, and return to the dated record when evaluating it later.
Consider a bounded example from our archived September 2026 Batch 7 equity scoring records. Apple's original five-year record showed a mean cumulative price-return scenario of 17.60% and a mean cumulative return scenario including dividends of 19.70%. These are distinct stored forecast measures. They are not returns an investor earned, and they do not prove forecast accuracy. The snapshot was dated 20 September, using a reference close dated 18 September; it is not a current Apple assessment.
The example was checked against an extraction containing 766 original records: 383 at each of the one-year and five-year horizons, with unique record IDs and no missing values in the four return fields examined. The broader lesson is the inspection habit: identify the edition, date, horizon and basis before interpreting a percentage. Our guide to CAGR and total return explains the calculation distinctions in more detail.
I put iPulse AI first for this particular task because preserving and interrogating forecast records is central to the product. Its limitation is equally important: an inspectable forecast remains uncertain. A transparent record supports evaluation; it does not substitute for demonstrated outcomes or your own risk assessment.
 2. Seeking Alpha: ratings and AI reports you can investigate
Seeking Alpha is worth inspecting when you want to understand why a stock receives a quantitative rating. Its official guide describes Quant Ratings based on financial information, price performance and analyst estimates, with five factor groups: valuation, growth, profitability, momentum and EPS revisions. The underlying metrics and factor grades are available to investigate, and the guide describes historical ratings and grades. Seeking Alpha's Quant Ratings guide.
Seeking Alpha also documents AI-powered Virtual Analyst Reports and Earnings Call Insights in its Premium service. Read those explanations alongside the underlying data, rather than treating an AI report and a Quant Rating as interchangeable. Seeking Alpha Premium overview.
That gives a practical starting point: inspect which factor is driving the result rather than treating the headline label as the entire analysis. A valuation weakness and an earnings-revision improvement raise different research questions.
This is a quantitative rating workflow; the cited methodology does not make its score equivalent to a conversational AI answer or a five-year return forecast. For a stock you already follow, examine the rating history, peer context and underlying figures. Then ask what changed and whether that change matters to your thesis. A favorable label alone cannot answer that question.
 3. Zacks: earnings-estimate revisions behind the rank
Zacks offers a different quantitative starting point. Its official advisor guide explains the Zacks Rank through four inputs: agreement among estimate revisions, the magnitude of revisions, upside potential from a recent estimate relative to consensus, and earnings surprises. It groups stocks into five ranks. Zacks Rank methodology guide.
This is useful to inspect when your question concerns changing earnings expectations. Rather than accepting the rank on its own, identify which estimates moved, the reporting period they concern and the information that prompted the changes. An earnings revision can be relevant without establishing a complete view of business quality or valuation.
The accessible source is an official methodology document whose publication date was not established in this review. It supports the description of the method, not a claim about today's coverage count, subscription features or realized performance. I would use the rank as an input to further research and verify the current explanation on the live product before relying on it.
 4. TipRanks: separate the score, analyst view and AI report
TipRanks deserves inspection if you want several kinds of market information in one research workflow. Its Smart Score guide describes a one-to-ten score built from eight factors, including analyst views, insider activity, hedge-fund activity, news sentiment, technical indicators and fundamentals. The component views can be explored separately. TipRanks Smart Score guide.
Its Stock AI Analysis introduction describes a report spanning fundamental, technical and sentiment analysis, including risks, financials, peer comparisons and earnings-call insights. TipRanks Stock AI Analysis.
The inspection task is to distinguish these outputs. A Smart Score, an analyst price target and an AI-written explanation are different claims with different inputs. If the report is positive while one underlying factor is negative, investigate the disagreement. Ask which evidence supports the conclusion, when that evidence was recorded and what would change the assessment. Combining signals is useful only when you can still understand the signals being combined.
 5. The Motley Fool: a long-term thesis with analyst involvement
The Motley Fool's Stock Advisor is relevant to readers who want an ongoing, long-term research service. Its current guide describes two new stock recommendations each month and a holding horizon of at least five years. It also explains a scorecard comparing recommendation returns with the S&P 500 over matching holding periods. The Motley Fool's Stock Advisor guide.
The same guide, updated 25 September 2026, describes an AI engine behind research tools and rankings, with analysts helping guide and review the system. It would therefore be inaccurate to describe this simply as a human-only alternative to AI research.
For this service, I would inspect the thesis and its updates: what must happen over the proposed holding period, which assumptions have changed, and how closed recommendations are represented alongside active ones. A long-term recommendation and a short-term technical signal need different evaluation windows. The guide's performance descriptions are provider claims; this comparison does not independently validate them.
 6. StockInvest.us: technical context alongside company analysis
StockInvest.us belongs in the comparison for readers who want to examine technical signals alongside a company research report. Its official AI Analysis page describes inputs including earnings-call transcripts, quarterly and annual reports, technical signals, expert insights and fundamental data. StockInvest.us AI Analysis.
That combination is worth investigating because a price pattern and a business development can point to different questions. Ask the report to identify which conclusion comes from technical data and which comes from a filing or earnings discussion. Check the relevant date and timeframe for each.
I would also inspect what any forecast range or signal is intended to represent before comparing it with another platform's output. A technical assessment for a shorter window cannot be evaluated as though it were a long-term valuation thesis. The documented list of inputs establishes the product's stated scope; it does not establish that its generated conclusions are accurate or that its signals outperform alternatives.
 7. InvestingPro and WarrenAI: conversational research to verify
Investing.com's WarrenAI offers a conversational entry point to financial research. Its product page presents workflows for earnings and fundamentals, market trends, technical insights, watchlists and screening. It also explicitly warns that WarrenAI can provide incorrect information and is not financial advice. WarrenAI product page.
For an investor comparing tools, the useful question is whether a conversation helps you move from a broad question to a specific, checkable claim. Ask for the reporting period, definition and source behind a number, then verify the answer against the original evidence. Follow-up questions should make the analysis more precise.
For example, a question about improving margins needs to specify which margin and which periods. A clear response can organize the next stage of research, but polished prose is not validation. Check current access and plan limits separately; this comparison does not quote a price or assert that every feature is included in every InvestingPro subscription.
Two additional tools: Fiscal.ai and TrendSpider
 Fiscal.ai: filing-linked financial research
Fiscal.ai is a useful additional candidate when your priority is financial statements and traceable document research. Its official workflow documentation describes source-linked financial data, with audit links to the relevant filing PDF page, and tasks such as financial models, peer comparisons, earnings-quality analysis and valuation. Fiscal.ai research workflow documentation.
For a practical inspection, follow one reported figure back to its filing page. Check whether the output uses standardized data or the company's as-reported presentation, and keep any forward assumptions separate from historical results. The documentation offers a strong reason to investigate this workflow; this review did not test a paid account or establish plan-by-plan availability.
 TrendSpider: chart-aware research assistance
TrendSpider's Sidekick is an additional candidate for a chart-based workflow. Its official help describes chart-aware assistance and research capabilities, while documenting limitations: it cannot execute trades on a user's behalf, and larger lists of tickers can require a scan rather than sequential analysis. The help page is dated 29 July 2026. TrendSpider Sidekick documentation.
Inspect the chart period, indicators and evidence behind the explanation. For research that includes strategy testing, distinguish an observation about a chart from a tested rule and its assumptions. Documentation alone does not establish the quality of a strategy or the accuracy of a generated interpretation.
A practical inspection worksheet before choosing a tool
Pick one company you already understand and one question you can verify. A good starting question is: “What changed in the company's latest reported results, and which assumptions would make the current thesis wrong?” Record the company, reporting period and research date before opening the tools. Use the same starting question wherever the product supports it; where it does not, record that difference rather than forcing an irrelevant comparison.
Use this worksheet to keep the evaluation concrete:
| Check | What to record | Why it matters |
|---|---|---|
| Source | Filing page, dataset, analyst record or stated model input | You need to see what supports the claim |
| Date | Reporting period, observation date and research edition | Old evidence can answer a different question |
| Output type | Historical fact, rating, opinion, summary or forecast | Each requires a different validation method |
| Definition | Units, accounting basis, horizon and return basis | Similar labels can describe different measures |
| Disagreement | Opposing evidence and assumptions | A useful explanation should survive a challenge |
| Preservation | Saved report, dated history or original edition | Later evaluation needs the earlier record |
For a historical financial number, the test is whether the cited source supports the figure and its definition. For a rating, the test starts with the model's stated inputs and intended use. For a forecast, later evaluation needs the original date and an outcome measured on the same horizon and basis. Do not collapse those tests into one star rating.
Try one follow-up that challenges the initial answer. If the conclusion is about improving profitability, ask what evidence would contradict it. If it is a forecast, ask which assumptions drive the result. If the product provides an analyst recommendation, examine the analyst's stated reasoning and the relevant update history. Record whether the reply identifies evidence or merely repeats the conclusion more confidently.
Access also belongs in the worksheet. Confirm that the companies, markets, documents and historical records you need are available in the plan you are considering. A feature may be documented without being included in your account. This article deliberately omits prices because unverified prices would make the comparison less useful.
Which stock research tool should you inspect first?
Start with the task that currently slows your research. If you want to inspect archived scenario forecasts, begin with the Forecast Library. If you want to interrogate a quantitative rating, examine Seeking Alpha or Zacks. If you want to separate analyst, sentiment and AI-report inputs, inspect TipRanks. If you want an ongoing long-term thesis, examine Stock Advisor. StockInvest.us and TrendSpider merit inspection for technical workflows; WarrenAI for conversational exploration; Fiscal.ai for filing-linked financial work.
These are starting points, not mutually exclusive choices. You can use one source to find a question and another to check its evidence. Preserve the reasoning that matters before moving to the next tool, and return to it when new information arrives. The tool earns its place in your process when it helps you make a claim more precise, find the supporting evidence or recognize an assumption you need to challenge.
This comparison is educational research, not investment advice or a recommendation to buy or sell any named security. Product documentation was reviewed on 3 October 2026. The Zacks guide's publication date was not established; the iPulse AI numerical example is an archived September scenario. No comparative investment-performance test was performed.
Featured image: original AI-generated editorial illustration. Its charts are symbolic and contain no investment-performance data.