

Most people treat AI stock research like a slot machine: whenever a stock price moves, they pull the lever and ask the model for a brand-new report.
Picture a scenario every investor knows by heart. A stock you’ve been watching drops 10% on a Tuesday morning. The deep-dive research report you read last month put a $120 price target on the company. Yesterday, at $100, that meant a respectable 20% upside. Today, at $90, the implied return just jumped to 33.3%.
Your instincts start firing. Is this a gift from a panicked market—or did the company’s biggest customer just walk out the door?
That is the most uncomfortable truth about buying the dip: a bargain price and a broken business arrive wearing the exact same disguise.
Now, most people think “AI stock research” is simple: just paste the same ticker into a chatbot on a $20-a-month subscription whenever you feel like investing. Hey, “I can do it daily”—NO PROBLEMO!
They have no idea what real algorithmic market intelligence actually takes when millions are at stake.
Asking a single LLM for a quick stock summary isn’t research; it’s reading a glorified headline. To seriously evaluate an equity market, you cannot rely on one prompt’s first impression. You have to run distinct analytical lenses and investment frameworks across hundreds of preselected stocks—stress-testing balance sheets, cash flows, competitive moats and macro risks.
The ten advisor configurations in our study alone generated 46.1 million tokens of report text plus 50.7 million reasoning tokens across four research runs. That is nearly 97 million generated tokens, alongside 529 million input tokens. A single full-universe pass consumes tens of millions of generated tokens.
At that scale, hitting “refresh” whenever stock prices move is no longer free. For a 500-asset universe, budget roughly $3,000 per cycle once retries, compute instances and other operating costs are included. Run that weekly for a $300,000 portfolio and you spend 1% of the starting capital every week just to refresh the research.
Yet doing the opposite—trusting last quarter’s brilliant AI research while the market shifts underneath you—can be lethal.
That cost creates a real dilemma for AI investment managers:
- If you re-run the AI every time stock prices move, the compute bill quickly eats into your investment returns.
- If you rely on old research for too long, you end up betting your money on outdated facts.
How fast does good research go bad? In our six-month study, reusing older AI stock targets with a price safeguard beat the S&P 500 in all three roughly 90-day holding windows, without paying for new AI reports.
But when we left the first selected portfolio untouched for 176 days, it lost 11.26%—while the portfolio selected using fresh reports gained 8.55%.
I wanted to find the smart middle ground between those two extremes. How much alpha can existing AI research still squeeze out if we rerate stocks based on their updated share price relative to the original forecast? And when does paying for a brand-new research run earn its keep?
In our new research paper, my team analyzed 8,120 historical iPulse AI reports across 203 stocks, tracking market outcomes across roughly six months. What we uncovered changed how we think about the lifespan of an idea, the illusion of AI “accuracy leaderboards,” and what a research budget should actually buy.
Why You Shouldn’t Pay an LLM to Do Basic Division
A stock price reprices in milliseconds. A real business—its customer retention, free cash flow, debt maturity wall, and competitive moat—usually evolves in slow motion.
That mismatch is the long-horizon investor’s greatest unfair advantage. If you do the heavy analytical lifting upfront to understand how a business makes money, you don't need to reinvent that knowledge every time the market throws a tantrum.
Think back to that $120 price target. When the stock drops from $100 to $90, calculating that your potential upside just rose from 20% to 33% takes a fraction of a millisecond in a spreadsheet. You do not need to pay an expensive frontier reasoning model to rediscover basic division.
What you do need to know is whether $120 still makes sense.
If the stock dropped because Treasury yields ticked up and dragged the whole index down, your original thesis is probably intact—and the stock really is on sale. If it dropped because a competitor launched a disruptive product or a refinancing lifeline evaporated, your $120 target is a ghost.
At iPulse AI, that distinction gives us a clear operating principle:
- Update prices and implied returns daily for pennies.
- Dampen extreme reactions to sudden, violent price swings so the system doesn't blindly chase falling knives.
- Direct heavy AI reasoning toward new evidence that threatens the thesis.
On paper, that sounds like common sense. We wanted to see if cold, hard market data would back it up.
Putting "Recycled" Research to the Test: 6,090 Head-to-Head Battles
To test how well older research holds up in the wild, we locked in a fixed universe of 203 stocks and tracked 10 distinct AI advisor configurations (spanning seven classic investment frameworks) across four historical research runs. That archive gave us 6,090 paired, head-to-head comparisons between aging reports and brand-new ones.
When a new period began, we tested four distinct ways to handle the portfolio update:
- Naive Price Update: Keep the old price targets and mechanically recalculate the upside from today’s lower or higher share price.
- Guarded Reuse (Old Targets + Safeguard): Keep the original price target, but apply a mathematical safeguard that dampens the signal when a stock experiences an unusually extreme price swing—preventing a collapsing stock from automatically looking like the "highest upside" pick in the universe.
- Mechanical Path Reset: Keep the old report's expected growth trajectory, but reset its starting line to today’s share price (which shifts the final dollar target).
- Fresh AI Research: Commission an entirely new council of AI reports from scratch, paying the full token and compute bill.
Don't overlook the subtle difference between #2 and #3. Guarded reuse believes the original destination ($120) is still valid, within reason. A mechanical path reset assumes the company will still grow by, say, 20% from wherever it trades today, moving the destination altogether. Both cost almost nothing to compute, yet they express completely different market beliefs.
To see how these choices performed against actual market outcomes, we had each approach rank the 203-stock universe using one-year signals and build a concentrated portfolio of the Top 10 equally weighted stocks. We tracked a $300,000 starting portfolio against SPY (the S&P 500 ETF), deducting 0.1% trading friction on every entry and exit—and charging the "Fresh Research" portfolio a full $3,000 operating-cycle bill, including retries and infrastructure.
Over three-month holding windows, the older research refused to die.
| Holding window | Old targets with safeguard | Fresh AI reports | S&P 500 (SPY) |
|---|---|---|---|
| May–July 2026 | +2.44% | +4.55% | +1.36% |
| June–September 2026* | +4.59% | +22.45% | +4.47% |
| July–September 2026 | +2.06% | +3.93% | +1.97% |
Source: Version 2 economic comparison; 10 bps per-leg trading fees.
Top 10 USD portfolio net returns. Source: study, Table 2. The June–September comparison includes a platform upgrade.
Look at the retained-target results. Guarded reuse beat the S&P 500 in all three windows without spending a single dollar on new AI reports. Even when we isolate the two periods where the underlying AI model version stayed completely identical (May–July and July–September), recycled research with a price safeguard averaged +2.25%, beating SPY’s +1.66% while trailing fresh research’s +4.24%.
Yes, fresh research won the gold medal—especially when paired with a platform upgrade in June, where it surged +22.45%.
But the real revelation was how much horsepower was still sitting inside the old reports. If you operate on a finite budget, this flips the standard AI workflow on its head. Before you ask, "How much will a new AI report improve my portfolio?", you should ask: "How much uncollected value is still sitting in the research I already paid for?"
Good research isn't a disposable tissue. It’s a capital asset. Replacing it should require a catalyst.
Day 176: When Good Research Goes Bad
If guarded reuse held up so well over 90 days, how far could we push our luck?
To find out, we took the initial May cohort and left the portfolio frozen for 176 days—nearly six months—with zero interim refreshes, zero thesis checks, and zero reranking.
The wheels came completely off:
- Guarded Reuse (Stale Research): -11.26%
- S&P 500 (SPY): +3.46%
- Fresh AI Reports: +8.55%
That is a 19.81-percentage-point gap between the two initial selections. The initial research that supported a useful shorter-window selection failed badly when we extended the hold toward six months.
This brings us to one of the most important concepts in modern AI investing: Thesis Half-Life.
Every stock forecast is a snapshot of a living ecosystem—customer budgets, interest rates, supply chains, debt covenants, and competitor pricing. The moment a report is published, reality begins drifting away from that snapshot.
Crucially, not all theses decay at the same speed. A consumer staples giant selling toothpaste might stay boringly predictable for eighteen months. A biotech firm awaiting an FDA ruling, or a levered SaaS company facing a debt maturity wall, can see its entire investment case evaporate on a single Thursday afternoon.
Putting every stock on a rigid calendar refresh misses the point. Price volatility is the smoke alarm; deep fundamental research tells you whether someone burned the toast or the house is actually on fire.
The Accuracy Leaderboard Mirage: How Identical Error Scores Pick Completely Different Stocks
Here is where the data threw us a curveball that every quant and AI builder needs to see.
When we measured standard forecast accuracy across the entire 203-stock universe in the same-model runs, Mechanical Path Reset (cheaply restarting the old growth curve from today's price) and Fresh AI Reports produced virtually identical average error scores: 13.55 vs. 13.51 percentage points.
If you were judging these two systems on a typical machine-learning benchmark leaderboard, you would call it a tie, pocket the compute savings, and go home.
Their highest-ranked forecasts looked like strangers.
Across the three transitions, the Top 10 shortlists ranked by 90-day forecasts from Path Reset and Fresh Reports shared only one, four, and four companies, respectively. Between 60% and 90% of the names differed.
How can two systems have almost the same average accuracy across 203 stocks, yet disagree on up to 90% of the stocks you should actually buy?
Because an average error score treats every stock equally, while a real portfolio concentrates 100% of its capital at the extreme tip of the spear.
Being 2% more accurate on the 140th-ranked stock you would never touch boosts your leaderboard score, while doing zero favors for your bank account. Meanwhile, re-evaluating a single piece of breaking news on a top-12 contender can knock a value trap out of your Top 10 and replace it with a multi-bagger.
Even portfolio sizing changes the rules of the game:
- When we expanded the portfolio from the Top 10 to the Top 30 stocks, Guarded Reuse actually beat Fresh Research in the same-model windows (+4.17% vs. +1.37%).
- Removing just the single biggest winner from each portfolio noticeably shifted the returns of both methods.
Never pick a financial AI system off an accuracy leaderboard alone. Ask what it actually buys, how concentrated its bets are, what happens when its top conviction misses, and what it costs to run.
The $3,000 Question: Why Account Size Dictates Your AI Strategy
Let’s talk about the elephant in the server room: who pays the bill?
Use $3,000 per 500-asset refresh as an operating-budget example, including retries, compute instances and other costs. That is the figure that matters when planning the broader service, rather than pricing only successful model responses.
One research bill can serve many investment decisions. Sharing its cost leaves more capital available to invest.
Look at the brutal math of fixed research costs:
- On a $10,000 account: a $3,000 refresh consumes 30% of starting capital.
- On a $300,000 portfolio: the same bill consumes 1%.
- Across $1 million: the initial burden falls to 0.3%.
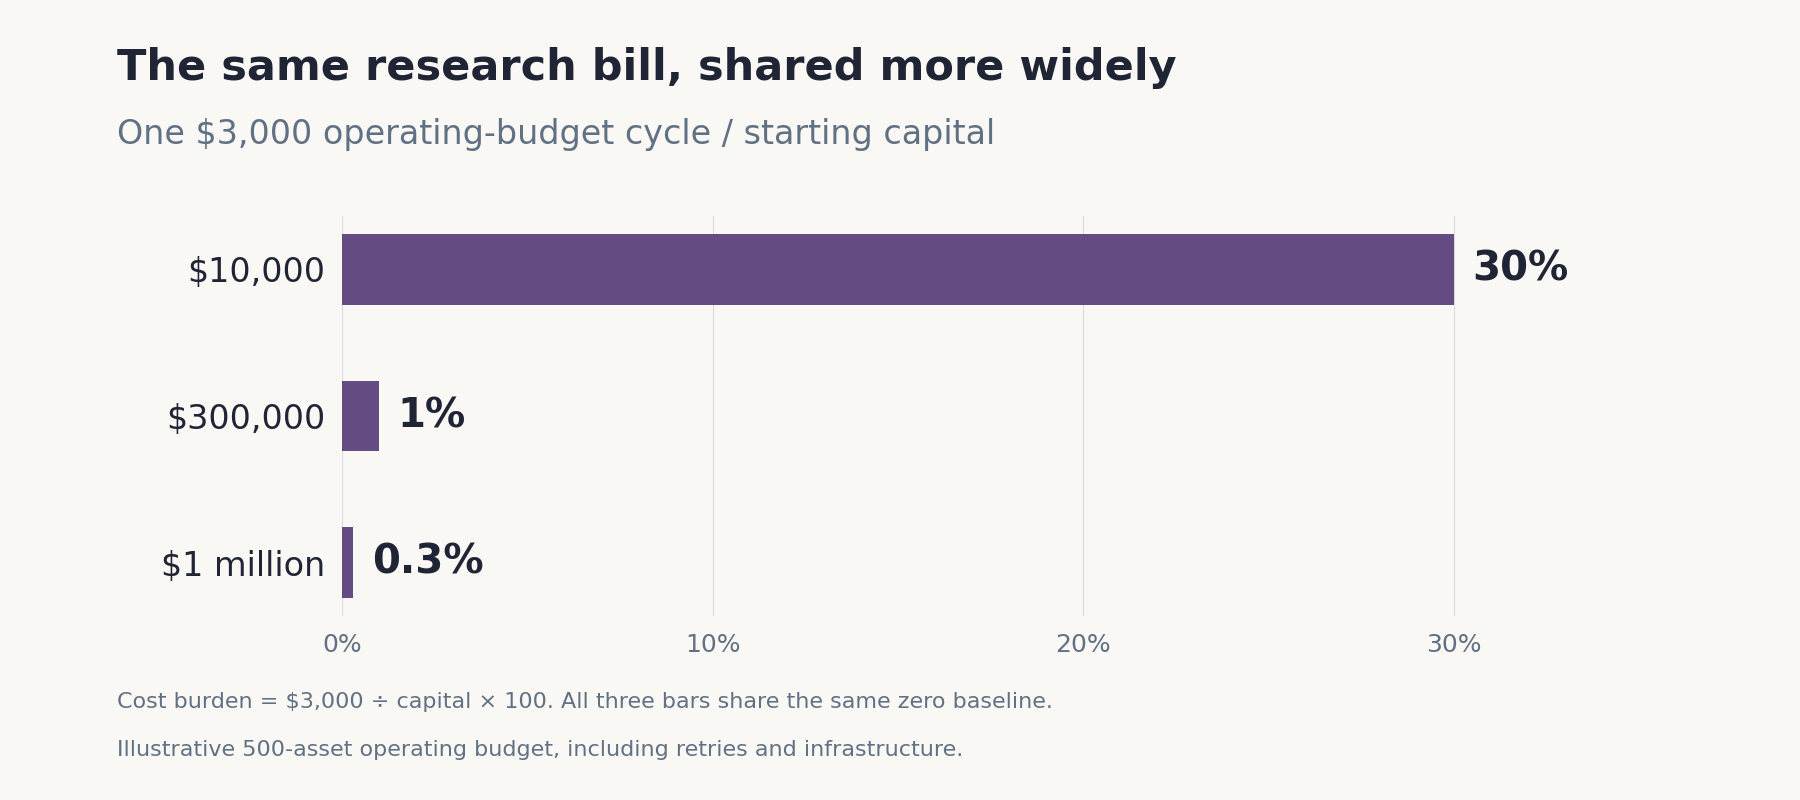
One $3,000 cycle as a share of starting capital. Sharing the research bill reduces the burden on each investor.
Source: Russlan Ramdowar / iPulse AI · As of 2026-11-04
At a weekly cadence, $3,000 becomes $156,000 a year. Monthly runs cost $36,000 a year. That is 52% versus 12% of a $300,000 starting portfolio spent on research alone. Frequency belongs in the investment decision, not just in the engineering roadmap.
The revised paper charges the full $3,000 bill to a $300,000 account. One fresh run still earns its keep in both unchanged-model Top 10 windows. But paying for a fresh run every month is a different commitment: three runs use $9,000 over the short windows. Weekly runs use $36,000–$39,000.
Hold the initial fresh-selected stocks fixed and reserve those bills upfront, and the difference becomes hard to ignore. Monthly budgets leave +2.44% and +1.83% in the two unchanged-model windows; weekly budgets leave −7.06% and −8.67%. Guarded reuse delivers +2.44% and +2.06%. Extra reruns have to improve decisions enough to close that gap. We did not generate weekly reports or assume they would pick the same stocks.
Over 176 days, the monthly budget is $18,000 and the weekly budget $78,000. After those reserves, the initial fresh selection returns +3.06% or −18.86%, respectively. This is why the goal is useful research at the right frequency—not maximum refresh frequency.
This is the economic case for shared research infrastructure. Apple’s balance sheet doesn’t change just because 10,000 different retail investors ask an LLM to read its 10-K on the same morning. Running 10,000 redundant reasoning loops only enriches cloud providers. Sharing one investigation across a community spreads the cost and leaves more money available to invest.
It also gives us a smarter blueprint for capital allocation: monitor the broad universe cheaply, and concentrate heavy compute where capital is actually about to be deployed.
A better ranking can extract more value from the same research
The updated paper adds another practical improvement: keep 75% of the original G10 score and blend in 25% of its updated score. Within a matched experiment using the same archived research, unchanged-model Top 10 reuse averages 6.19% rather than 4.96% for unblended G10. That 1.23 percentage-point gain is separate from the original price-update comparison above. It shrinks to 0.67 percentage points when each portfolio's largest winner is held in cash, and it does not consistently help broader Top 30 portfolios or solve thesis ageing. Better ranking and fresh fundamental research answer different questions; the new result strengthens the case for extracting useful value from existing research before paying for another run.
Auditing the Final Boss: Does the "Editorial Agent" Actually Add Value?
In multi-agent AI workflows, it’s fashionable to stack another "reviewer" or "editor-in-chief" agent on top of the pipeline to make the final call. We decided to audit our own final editorial review layer across nine published Top 10 editions to see where the magic was really happening.
On the surface, the published portfolios looked dynamic: two to eight new stocks rotated into the Top 10 from one edition to the next.
But when we traced the lineage of every single stock pick, we found a sobering truth: 100% of that turnover had already happened upstream.
The incoming candidate lists had already changed before the final screen. When that shortlist reached the final editorial screen, the screen passed it through untouched every single time. Giving the final review layer credit for the dynamic portfolio changes would be like giving the mail carrier credit for writing the check.
In an AI system—just like on Wall Street—every layer in the hierarchy has to justify its seat at the table. A useful final review should be more than a rubber stamp. It should leave a hard, auditable paper trail:
- What new real-world fact was verified?
- Why did a borderline candidate survive scrutiny?
- Which broken thesis got vetoed—and which #11 or #12 reserve stock stepped up to take its place?
If a review agent cannot show the evidence it checked or the failures it prevented, another layer may just be expensive theater.
Our Verdict: How to Spend Your Research Budget in 2026
After sifting through 8,120 reports and 6,090 paired forecast comparisons, the lesson isn't that AI research is "always worth it" or "a waste of money." The edge comes from knowing when to recalculate and when to rethink:
- Respect the power of good initial work: In all three roughly 90-day windows, old targets repriced at entry with a safeguard beat the S&P 500 without new inference.
- Never let a thesis outlive its shelf life: By Day 176, the retained-target selection had produced an 11.26% loss. Research can lose its usefulness—and fast-moving events accelerate the process.
- Ignore vanity accuracy scores: Two systems with almost the same 13.5-percentage-point average error across the market can disagree on up to 90% of the forecast-ranked Top 10 shortlist. Test the portfolio decision, not just the global average.
- Trigger deep research by evidence, not habit: Keep your watchlist under cheap, automated price surveillance. Save the heavy reasoning compute for the moments when a stock enters your buy zone or new evidence challenges what you believe.
The next time a stock on your watchlist drops 10% and your spreadsheet flashes a mouth-watering 33% upside, don't blindly hit buy—and don't blindly pay an AI to rewrite history from scratch. Treat that widening gap as a flare in the night sky. Your job is to find out whether the market just handed you a discount, or whether the company you fell in love with has already left the building.
This article is for educational purposes and is not investment advice.
Research note: Historical comparisons use overlapping windows and a fixed 203-stock panel, with outcomes through 30 October 2026. The tests select portfolios at entry; they do not simulate daily reranking or identify an optimal refresh trigger. The 176-day extension holds the first cohort without interim reranking and does not establish a universal expiry date or prove why the portfolio lost value. Portfolio breadth and individual winners affect results. Version 2 uses a $300,000 account and a $3,000 all-in, 500-asset run as a planning assumption; selection remains within the matched 203 stocks. Recurring-budget scenarios hold the initial selection fixed, with the scheduled research budget reserved upfront; they do not measure weekly/monthly refresh policy returns. Token totals cover 8,120 successful matched reports and include separately reported reasoning tokens; retries and synthesis are outside that count. The author is the founder of iPulse AI and holds a commercial interest in the platform.
Want to dig into the evidence? Read the full paper on arXiv, explore the Zenodo research deposit, or inspect the reproduction code on GitHub.


