

When is another AI research run worth more than keeping that money invested? Imagine maintaining fundamental research on 203 stocks while investing in only ten of them at a time. Market prices fluctuate every day, but a company's underlying business trajectory rarely changes overnight. Under a finite compute budget, the operational question is how much decision value can be retained by updating market prices against existing research, and when new evidence warrants a fresh multi-agent deep dive.
Generating the 8,120 matched iPulse AI reports consumed nearly 100 million output and reasoning tokens: 96,830,247 in the audited logs. The practical question is how much useful decision value remains in that research before funding another run. A falling share price can signal a better bargain or a broken investment thesis; the value of a refresh lies in resolving that distinction before capital is committed.
- Stocks held constant
- 203
- Archived reports
- 8,120
- Paired comparisons
- 6,090
Across four production batches
Ten matched configurations; seven frameworks
Three refresh transitions
The budget question behind fresh analysis
iPulse AI is an Open Agentic Investment Research Platform for long-horizon investing. Its architecture separates individual framework reports, consensus synthesis, scored stock lists and editorial checks of the shortlist. The cost question is not just which model to call. It is whether a broad council needs to be called again at all when a price update is available.
That question applies beyond investing: any organization monitoring hundreds of candidates while acting on a small shortlist must choose where to spend its next unit of research. More frequent inference can repeat context, introduce stochastic variation and change rankings without necessarily improving the decisions that follow.
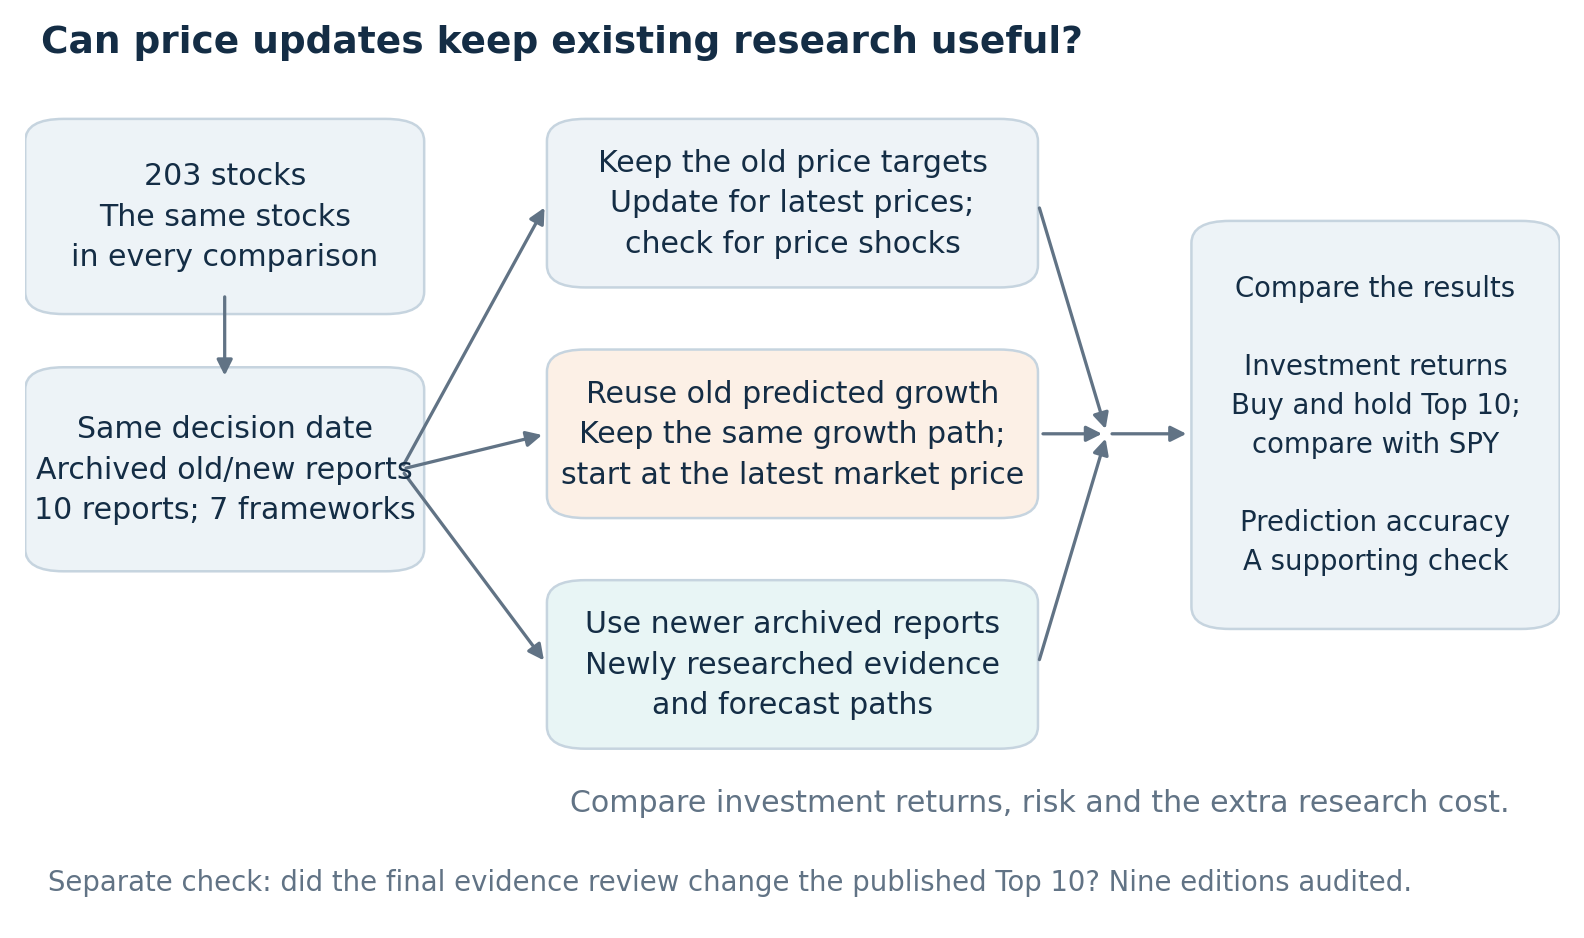
Paper Figure 1. The matched experiment starts with the same 203 stocks across four historical batches.
Source: Russlan Ramdowar / iPulse AI · As of 2026-11-04
Four update policies, separated clearly
- Fixed-target repricing: retain the original target price and calculate its remaining upside from the latest market quote.
- Guarded repricing: retain the target while applying a volatility-scaled safeguard so a sharp price fall is not automatically treated as a stronger opportunity.
- Mechanical path reset: preserve the old forecast’s remaining growth shape but re-anchor it to the current price. This changes the implied target without new reasoning.
- Fresh reports: rerun the multi-agent analysis with updated inputs to generate new theses and forecast paths.
Daily fixed-target repricing with a shock safeguard is the existing production approach. A mechanical path reset is a separate experimental comparison. Keeping them distinct is essential to interpreting the results.
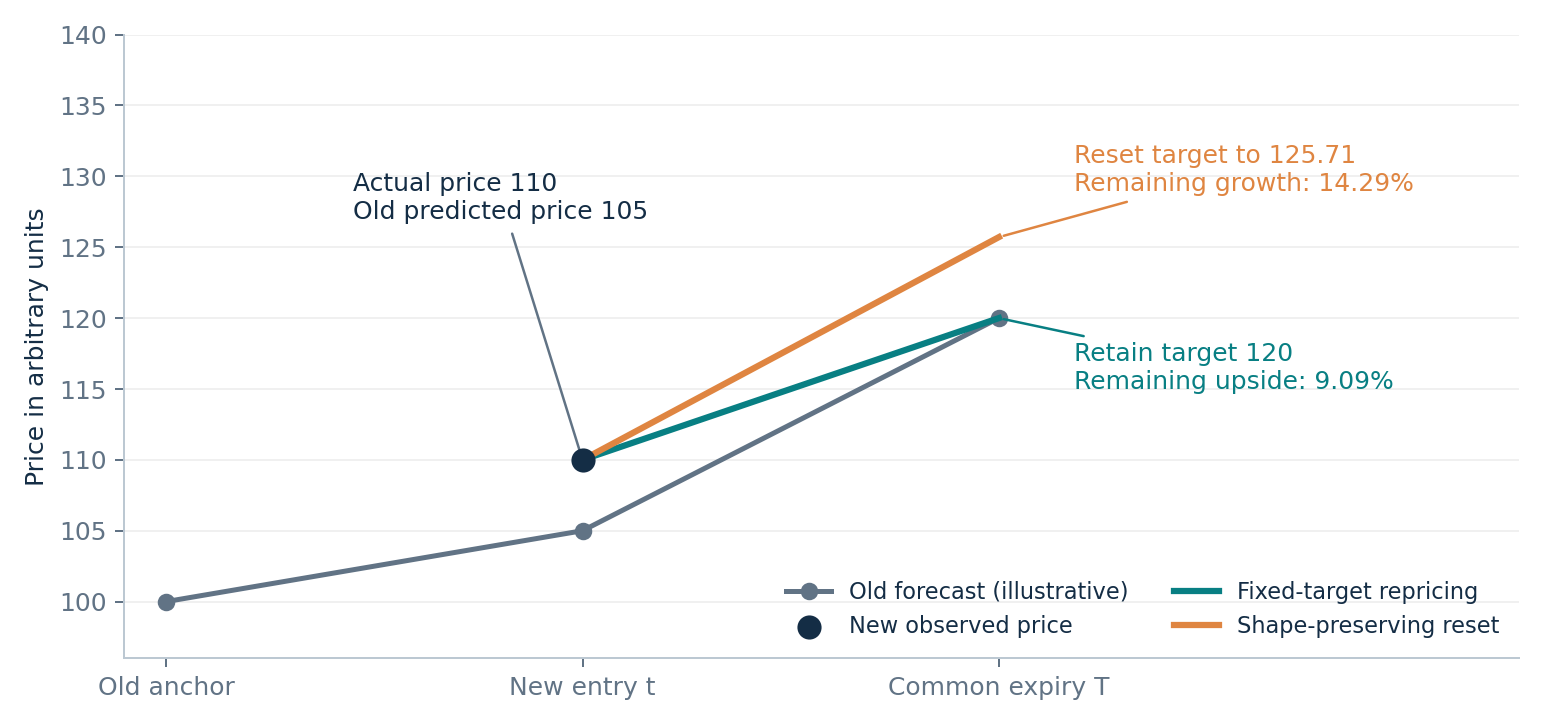
Paper Figure 2. Repricing preserves an absolute target; path reset changes that target without new inference.
Source: Russlan Ramdowar / iPulse AI · As of 2026-11-04
A paired study of the same 203 stocks
The economic and forecast tests retain the same ten configurations across seven investment frameworks in Batches 3–6. The two same-model transitions, 3→4 and 5→6, hold exact model release identifiers constant. The evolving-system series also includes 4→5, when model capabilities, fundamentals and output schemas changed. The earlier Batches 1–2 used materially different protocols and are excluded.
For each stock, all comparison arms use the same entry date, market price and evaluation horizon. Reports are combined by first averaging modes within each framework, then giving each framework one-seventh of the total weight. The main economic test selects equal-weight Top 10 USD portfolios from one-year forecasts on USD 300,000, including 10 basis points of trading costs per leg and the USD 3,000 all-in operating charge for Fresh. SPY is the benchmark. Market outcomes are frozen at 30 October 2026.
Existing research retained useful short-window value
Guarded reuse beat SPY in all three short holding windows. In the two unchanged-model windows, it averaged 2.25%, compared with 1.66% for SPY and 4.24% for fresh reports. Reusing the research therefore retained useful decision value without paying for new inference, while fresh analysis performed better in the primary Top 10 comparison.
| Policy | Net return |
|---|---|
| Old targets, repriced | 2.54% |
| Old targets with shock guard | 2.25% |
| Mechanical path reset | 4.65% |
| Fresh deep reports | 4.24% |
| SPY | 1.66% |
Source: Paper Table 2; arithmetic mean of the two unchanged-model short windows, USD 300,000, modeled trading and research costs.
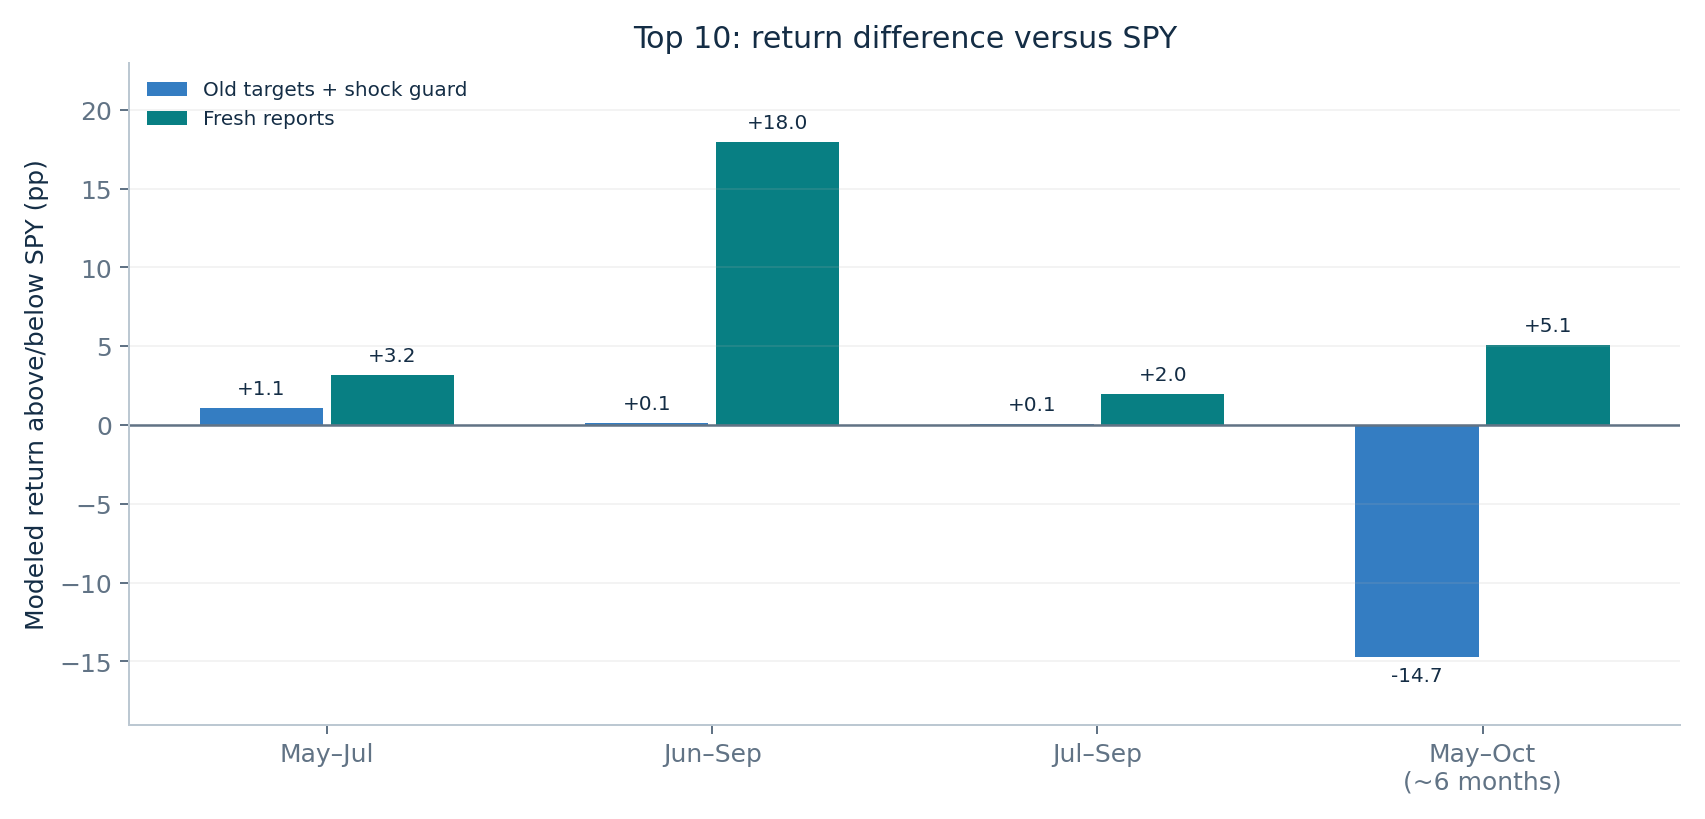
Paper Figure 3. One-year forecast signals; USD 300,000; modeled trading and USD 3,000 operating costs.
Source: Russlan Ramdowar / iPulse AI · As of 2026-11-04
The longer window changes the story. Extending the first holding period to 176 days without a refresh leaves guarded reuse at −11.26%, fresh reports at +8.55% and SPY at +3.46%. This makes the thesis half-life question tangible: useful research can age, and price monitoring alone cannot rebuild a thesis whose evidence has changed.
Nearly identical errors can hide very different choices
The supporting completed-quarter forecast test compares absolute errors. In the same-model series, fixed targets have mean absolute error of 15.257 percentage points, mechanical reset 13.548 and fresh reports 13.507. Resetting the old growth path closes about 98% of the error gap between fixed targets and fresh reports without a new model call.
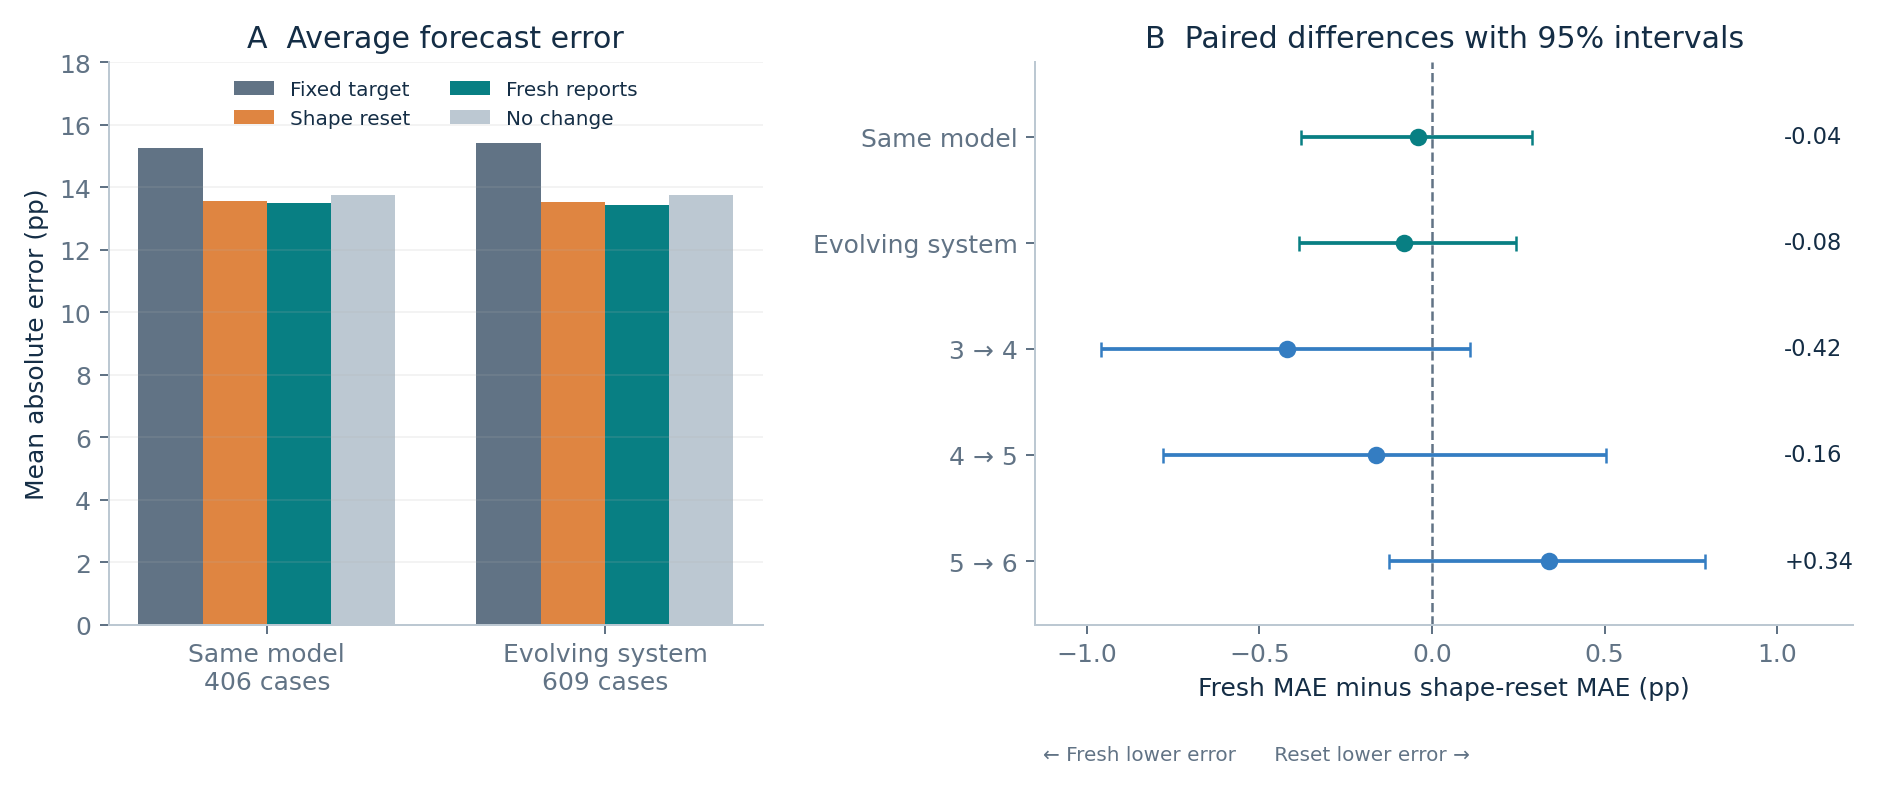
Paper Figure 5. Completed-quarter forecast diagnostics, measured in percentage points.
Source: Russlan Ramdowar / iPulse AI · As of 2026-11-04
Yet Fresh and Reset share only one to four of their Top 10 stocks. A difference of roughly 0.04 percentage points in average error can coexist with 60%–90% shortlist turnover. A model update should therefore be evaluated on the decisions it changes, rather than a statistical loss in isolation.
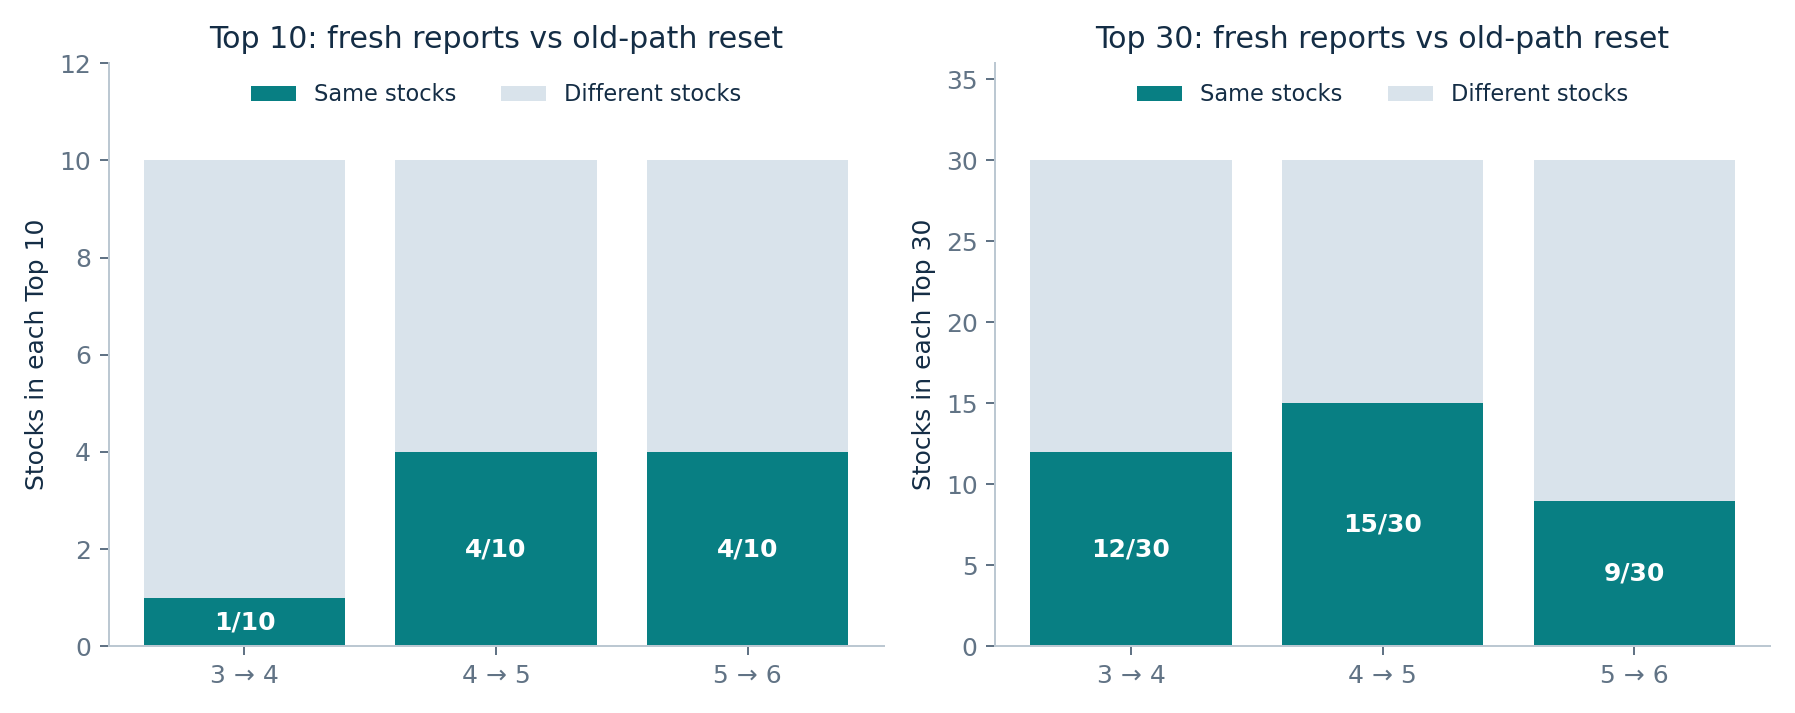
Paper Figure 8. Similar average error can coexist with substantial changes in the stocks selected.
Source: Russlan Ramdowar / iPulse AI · As of 2026-11-04
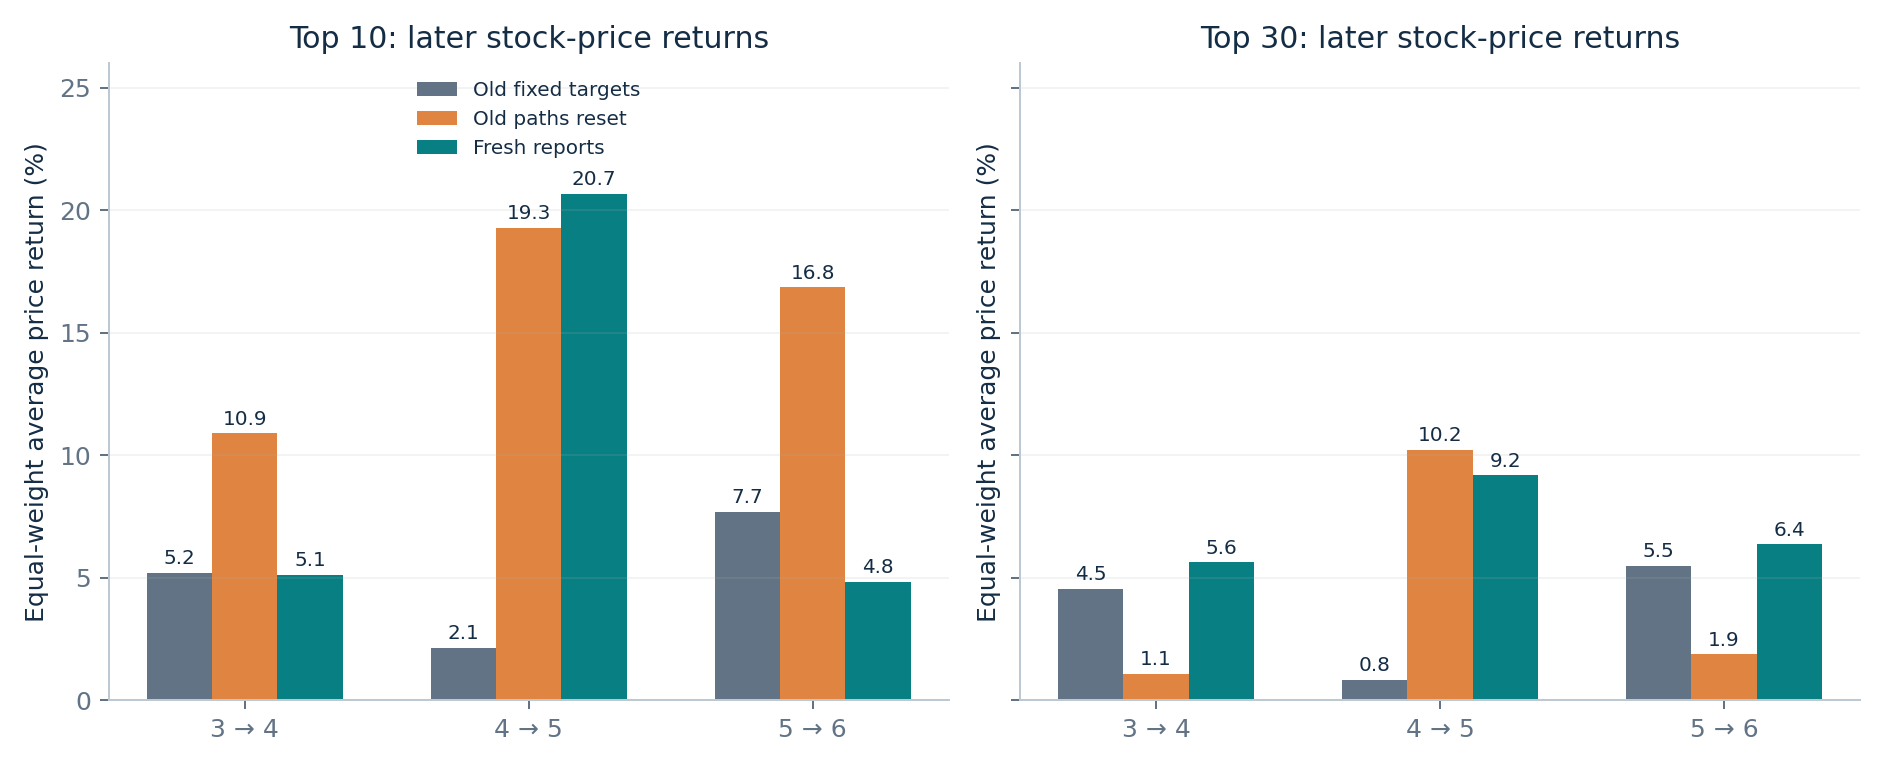
Paper Figure 9. Supporting stock-selection diagnostics, distinct from the primary one-year-signal portfolio test.
Source: Russlan Ramdowar / iPulse AI · As of 2026-11-04
Portfolio breadth and exceptional winners change the verdict
Expanding the portfolio to Top 30 reverses the unchanged-model comparison: guarded reuse averages 4.17% versus 1.37% for fresh reports. Concentration tests also show how much a small portfolio can depend on a single winner. Removing MRNA from one June Fresh portfolio reduces its return from 22.45% to 2.22%. These are useful checks when interpreting an apparently decisive headline result.
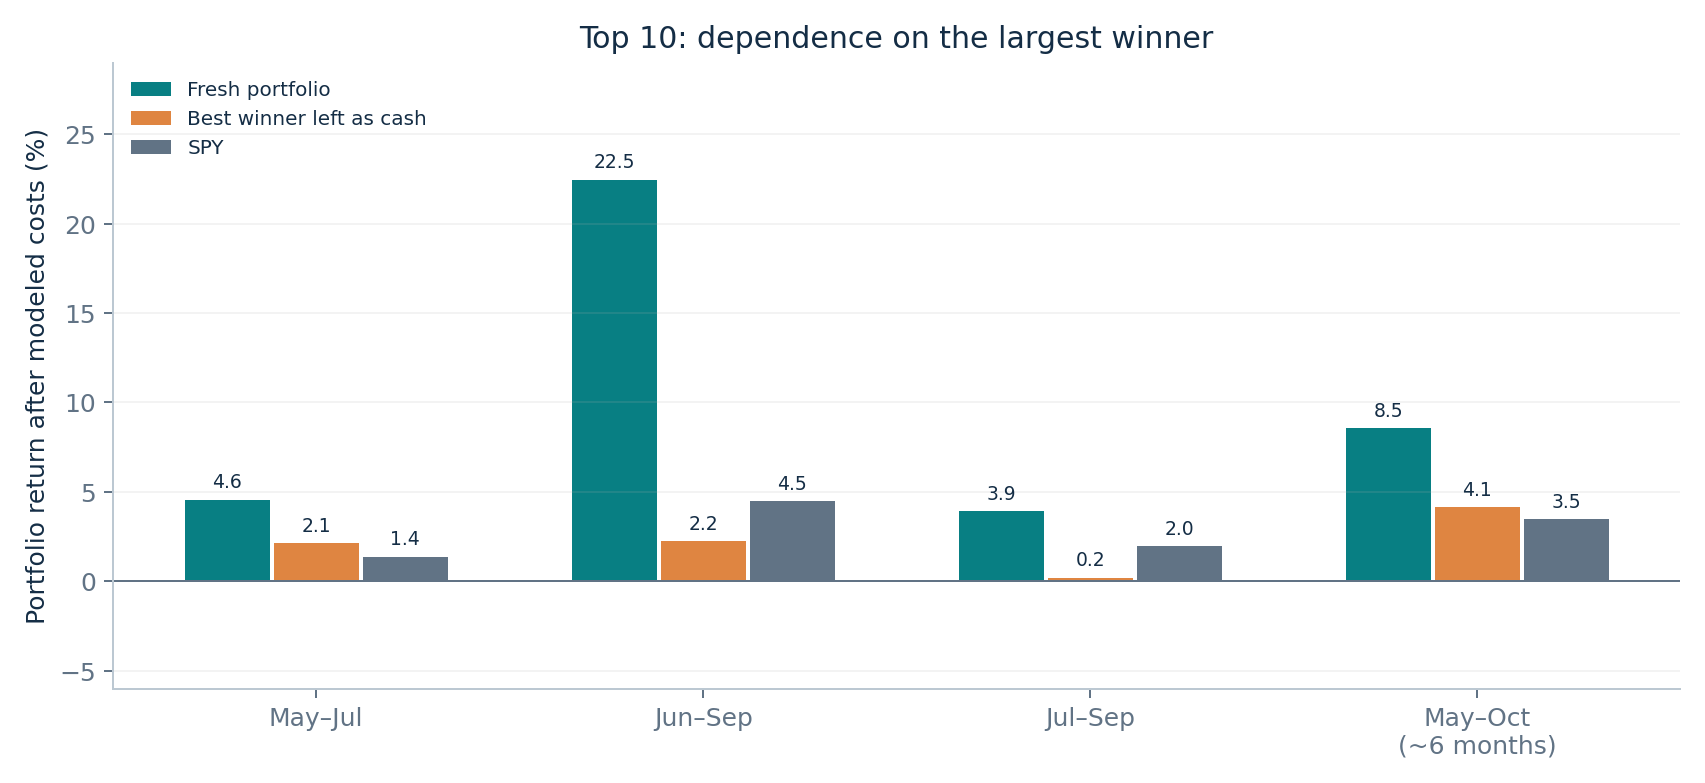
Paper Figure 4. Sensitivity analysis shows the influence of breadth and individual winners.
Source: Russlan Ramdowar / iPulse AI · As of 2026-11-04
The research bill belongs in the investment comparison
The revised primary comparison uses a USD 300,000 portfolio paying USD 3,000 for a full 500-asset operating cycle, including retries, instances and infrastructure. This is an all-in planning assumption; selections remain within the same matched 203 stocks. A separate shared allocation assigns USD 1,218 of that cycle to 203 assets. Measured successful-report token charges remain a separate benchmark.
A single fresh run earns back its USD 3,000 bill in both unchanged-model Top 10 windows. Their realized research ceilings at USD 300,000 are about USD 8,990 and USD 8,326. Recurring budgets pose a harder test: three monthly runs cost USD 9,000, while 12–13 weekly runs cost USD 36,000–39,000 over the short windows. Over 176 days, six monthly runs cost USD 18,000 and 26 weekly runs cost USD 78,000.
To isolate the recurring-cost hurdle, the study reserves the scheduled research bill upfront in zero-interest cash and holds the initial Fresh Top 10 selection fixed. Additional reruns must improve decisions enough to cover this hurdle; no intermediate forecasts or trades are invented.
| Window | Cadence | Runs | Budget | Fresh held | Guarded reuse |
|---|---|---|---|---|---|
| 05-07–07-30 | Weekly | 12 | $36,000 | -7.06% | +2.44% |
| 05-07–07-30 | Monthly | 3 | $9,000 | +2.44% | +2.44% |
| 06-09–09-04 | Weekly | 13 | $39,000 | +7.61% | +4.59% |
| 06-09–09-04 | Monthly | 3 | $9,000 | +19.98% | +4.59% |
| 07-07–09-30 | Weekly | 13 | $39,000 | -8.67% | +2.06% |
| 07-07–09-30 | Monthly | 3 | $9,000 | +1.83% | +2.06% |
| 05-07–10-30 | Weekly | 26 | $78,000 | -18.86% | -11.26% |
| 05-07–10-30 | Monthly | 6 | $18,000 | +3.06% | -11.26% |
Source: Initial run included; no run at liquidation. Fixed-selection cost scenarios, not measured weekly/monthly refresh-policy returns.
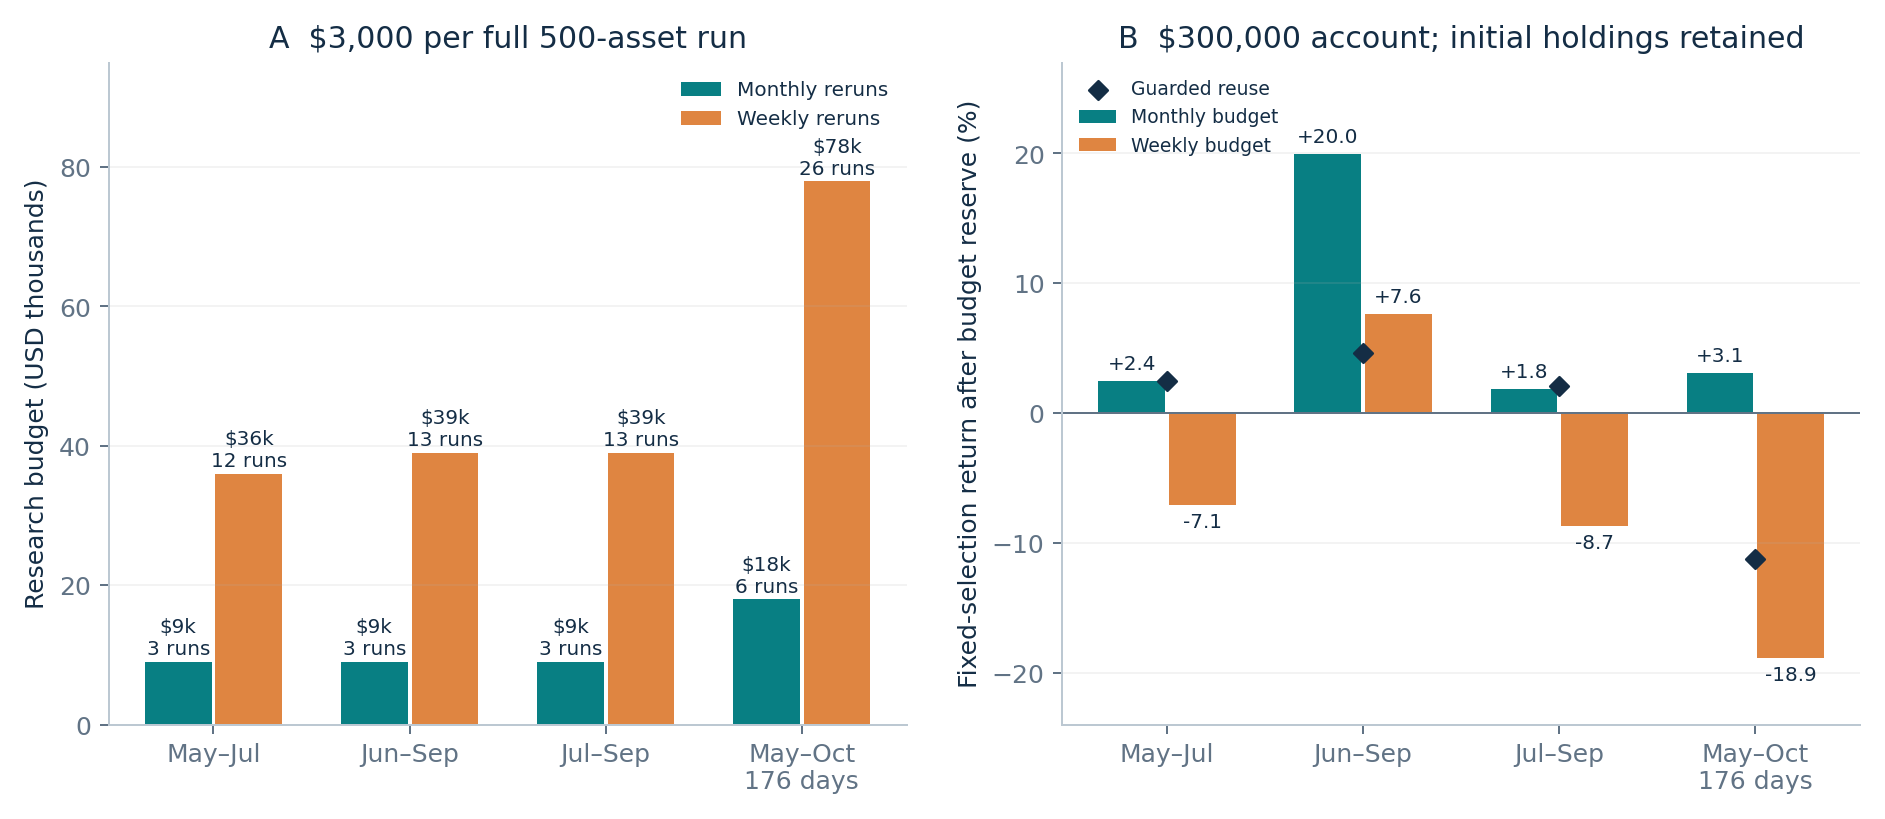
Paper Figure 6. Weekly versus monthly operating budgets at USD 3,000 per 500-asset run; USD 300,000 account. Initial selections are held fixed.
Source: Russlan Ramdowar / iPulse AI · As of 2026-11-04
Improving the ranking of retained research
Version 2.1 adds a matched ranking experiment without replacing the original research-budget comparison. It applies the G10 return-focused score to the same seven-framework councils and blends 75% of each asset's frozen original score with 25% of its price-updated score. In the two unchanged-model Top 10 reuse windows, mean net return rises from 4.96% with unblended G10 to 6.19% with the blend, a 1.23 percentage-point improvement. The inputs, entry dates, net-dividend wallets, trading costs and research budgets are matched within this extension.
The improvement is concentrated: after placing each arm's best-performing stock in cash, the mean advantage falls to 0.67 percentage points. The blend is weaker for Top 30 in two of three short windows and does not prevent thesis ageing in the 176-day extension. Top 10 overlap with a fixed fresh-research G10 reference improves from 2, 3 and 2 names to 3, 5 and 4 names; this is shortlist agreement, not proof that fresh reports are ground truth. These results support improving how existing research is ranked while preserving evidence-triggered thesis rebuilding. A separate scoring and rescoring study examines formula and strategy choices in depth.
What the editorial audit actually found
The published Top 10 did change between editions: all eight consecutive comparisons replaced between two and eight names. Within each of the nine editions, however, the final editorial screen retained its own incoming candidate list. Changes between weekly lists and interventions by the final screen are different measurements.
The audit also found that the review helper supplied positive validity decisions automatically. This archive therefore cannot establish the value of an independent editorial challenge. The practical response is to require explicit, evidence-backed decisions, preserve invalidations and allow reserve candidates to be considered when a shortlisted thesis fails.
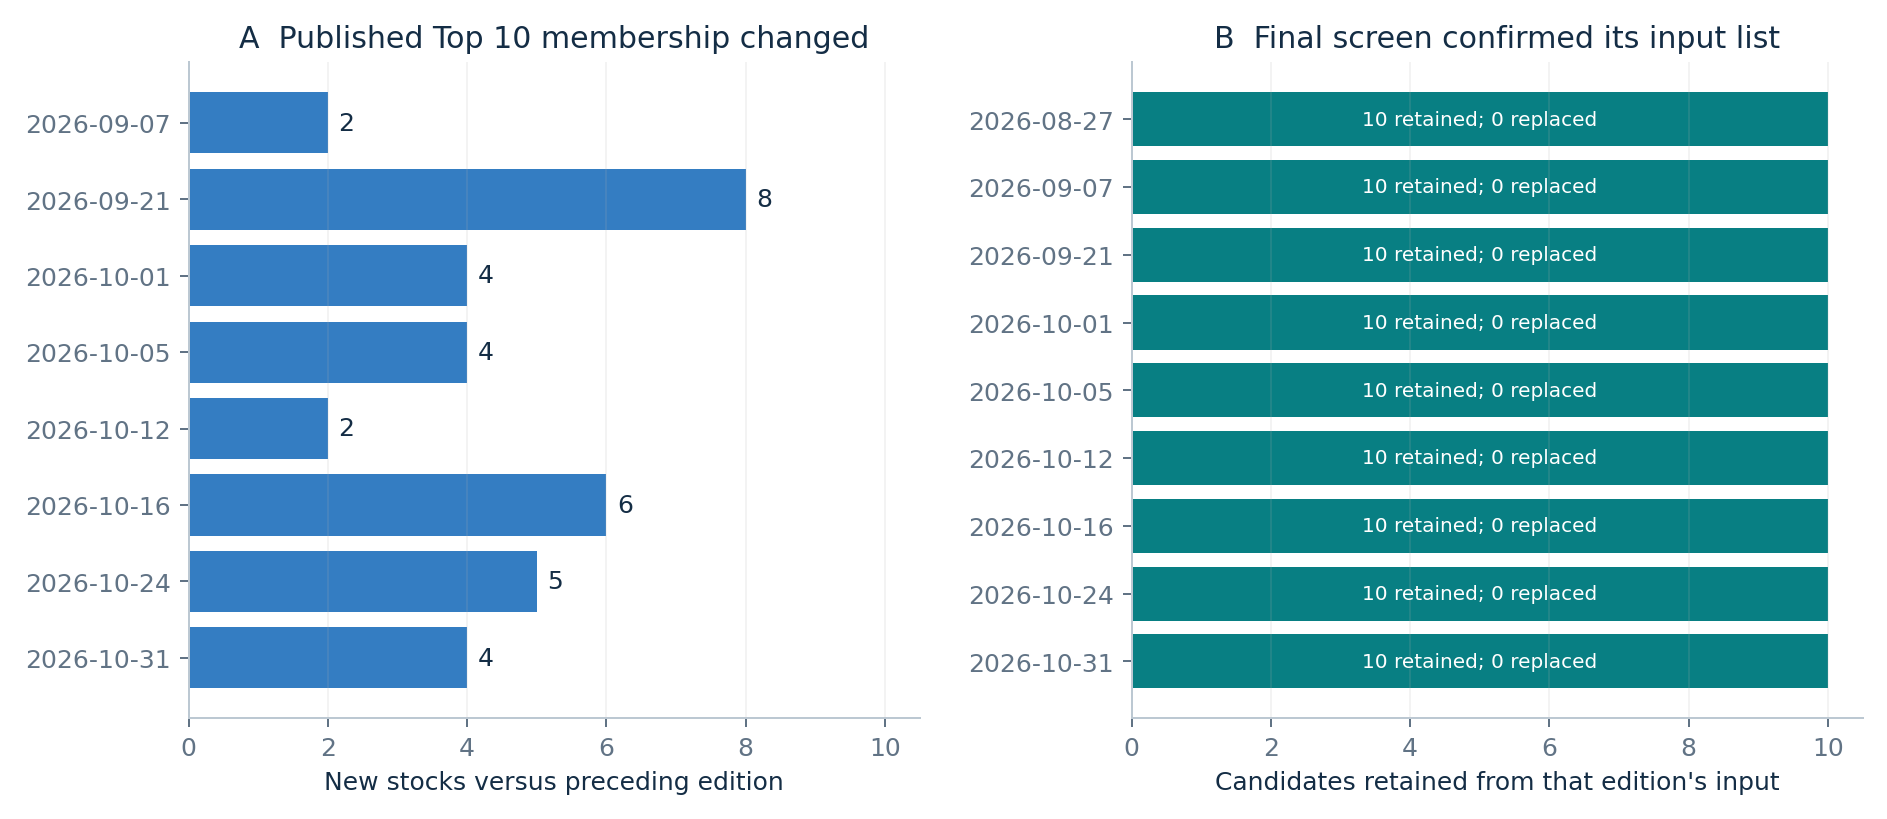
Paper Figure 7. All eight between-edition comparisons change membership; each final screen retains its own input.
Source: Russlan Ramdowar / iPulse AI · As of 2026-11-04
What this means for an investment research platform
- Keep price monitoring continuous: update the remaining upside of a frozen forecast as market quotes move.
- Use shock checks and dated evidence to distinguish a cheaper stock from a broken thesis.
- Reserve deeper multi-agent work for scheduled refreshes and material changes, then measure its marginal value against the cheaper baseline.
- Evaluate the actual decision: portfolio breadth, costs, holding period and dependence on exceptional winners belong beside forecast error.
- Make editorial review an explicit evidence test of shortlisted candidates, with a recorded reason for retention or invalidation.
Scope and limitations
This is a retrospective, complete-case study of 203 stocks over a small number of overlapping market windows. Same-model runs still differ in prompts and inputs. The portfolios use a controlled equal-framework forecast ranking rather than replaying the full production consensus and eligibility pipeline. Breadth, endpoints, guard inputs and exceptional winners materially affect outcomes. The study identifies neither a universally optimal refresh interval nor a calibrated thesis half-life; the editorial archive does not isolate the causal value of independent review. Weekly/monthly budget scenarios reserve scheduled research costs upfront while retaining the initial selection; the archive contains no weekly fresh reports or observed recurring-refresh strategy.
Paper, data and reproducibility
The full paper documents the equations, cohort, execution dates, cost assumptions, robustness checks and appendices. Zenodo preserves the PDF, LaTeX source and research-artifact package. GitHub provides the forecast-only exports, aggregate results, exact selection records and reproduction adapters. Historical market inputs remain outside the public archive. The paper and original research exports are CC BY 4.0; focused reproduction code is MIT.
Author: Russlan Ramdowar, Future Edge Group FZE; ORCID 0009-0004-9311-6957. The author is the founder of iPulse AI and has a commercial interest in the platform. The manuscript retains its approved AI-assistance disclosure. This page summarizes the version-2 paper; the linked archive preserves the exact original files and version history.


