Seven AI advisors reach similar forecasts. Does that make their forecast more reliable, or was the asset simply easier to forecast? This paper separates those explanations using completed outcomes from the ordinary iPulse AI research archive.
- Completed quarterly outcomes
- 928
- Assets in the primary panel
- 232
- Framework-level forecasts
- 7
Four historical production batches.
Each asset contributes four outcomes.
Ten historical Gemini configurations, grouped before aggregation.
Agreement is visible immediately. Correctness arrives later.
Consider two assets. One has a stable price history and the advisors predict modest returns close together. The other is volatile and their forecasts differ widely. If the first council later has smaller errors, agreement appears useful. But a forecast that ignores every advisor and predicts no price change might also have smaller errors on the stable asset. Agreement could be identifying forecast difficulty without identifying where the council adds value.
The study therefore asks three separate questions: how risky the asset is, whether the advisors agree about its direction, and how precisely they forecast the size of its return. These questions need different tests; a single confidence score can conceal the distinction.
Overall skill is the starting point
Start with overall forecasting skill. Council MAE is 15.15 percentage points versus 14.99 for no change, with an unresolved paired difference of +0.16 points [-0.23, 0.56]. Mean-sign accuracy is 48.38%, versus 50.75% for always up. These losses do not establish a general advantage, nor do they evaluate the platform’s qualitative research or deployed synthesizer.
Study design: a fixed historical council, evaluated against later prices
iPulse AI is an Open Agentic Investment Research Platform. Its production workflow uses configured investment frameworks and modes, followed by a synthesis layer. This study isolates an equally weighted historical council from individual forecasts. It does not test the evidence-weighted synthesizer or compare current provider models.
Ten archived Gemini configurations represent seven investment frameworks. Forecasts are first averaged within each framework, then the seven framework forecasts receive equal weight. All configurations share historical Gemini model versions. Framework diversity is not provider diversity or statistical independence.
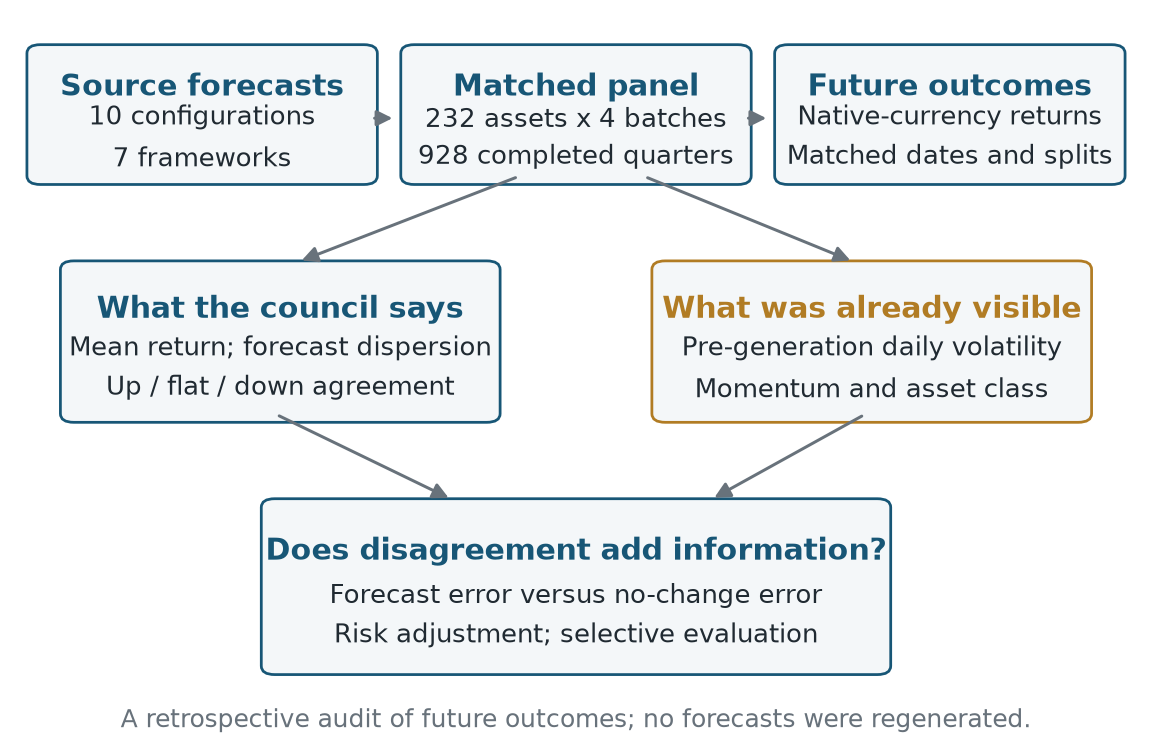
Study design. The analysis distinguishes raw error, error relative to a no-change baseline, and selective evaluation.
Source: When AI Advisors Agree — Figure 1 · As of 2026-10-08
Figure from the published preprint. Pointwise asset-cluster intervals and retrospective scope are described in the paper.
The primary panel contains 232 assets with complete observations across Batches 3–6, issued between April and July 2026. Its 928 first-quarter outcomes had matured by the 8 October cutoff. Batch 7 is excluded because its native first-quarter targets had not matured. The broader matched cohort contains 1,227 records; it is distinct from the balanced primary panel.
Forecast targets and realized target prices are expressed relative to the first saved closing price after generation. This is a common evaluation entry, not an assumed executable trade at the generation instant. Historical volatility and other price-history risk measures use dates strictly before generation. Returns are in native currency and exclude dividends, currency conversion and trading costs.
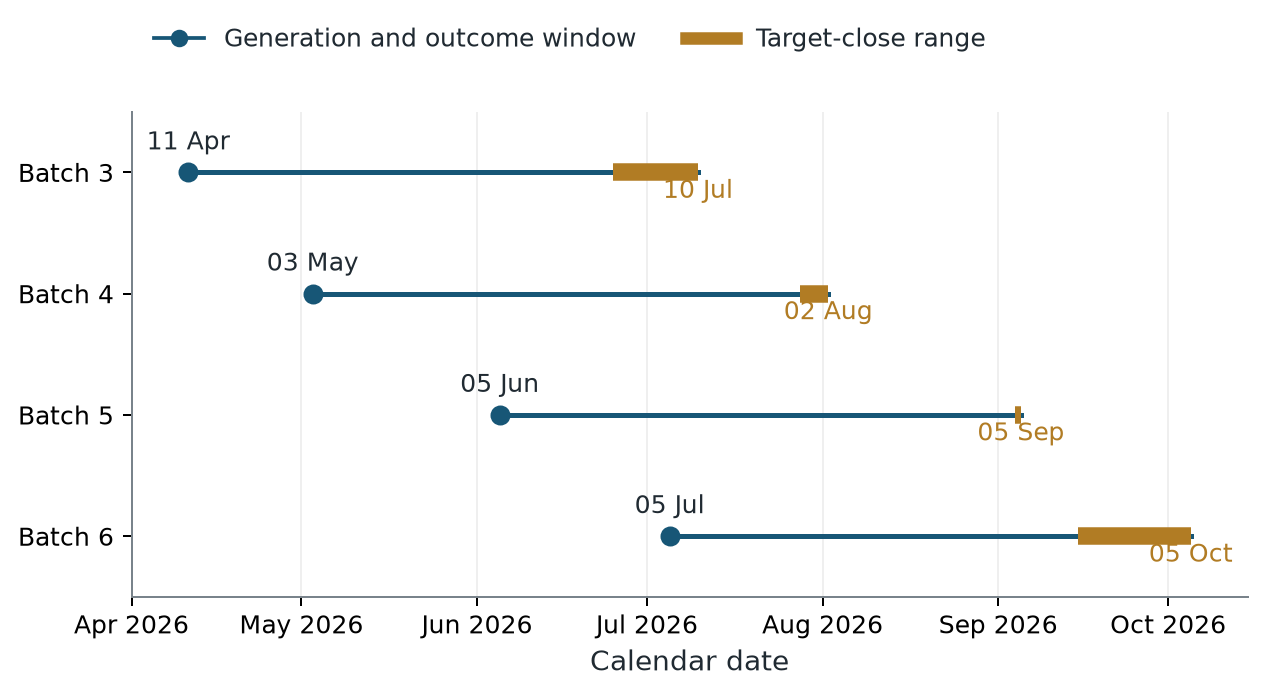
Blue circles mark generation; gold segments show target-close ranges. Most preceding-quarter outcomes were unavailable at the next generation, so adjusted models are retrospective diagnostics.
Source: When AI Advisors Agree — Figure 2 · As of 2026-10-08
Figure from the published preprint. Pointwise asset-cluster intervals and retrospective scope are described in the paper.
A strong disagreement–error pattern also appears without the AI council
Mean absolute return error rises from 10.31 percentage points in the lowest-disagreement quartile to 21.05 in the highest. Taken alone, that looks like a compelling argument for treating agreement as confidence. Yet the no-change forecast follows nearly the same pattern: 9.89 to 21.15 percentage points.
| Mean absolute error | Lowest disagreement | Highest disagreement |
|---|---|---|
| AI council | 10.31 pp | 21.05 pp |
| No price change | 9.89 pp | 21.15 pp |
Source: Primary panel, 928 outcomes. pp means percentage points of return; these are absolute errors, not investment returns.
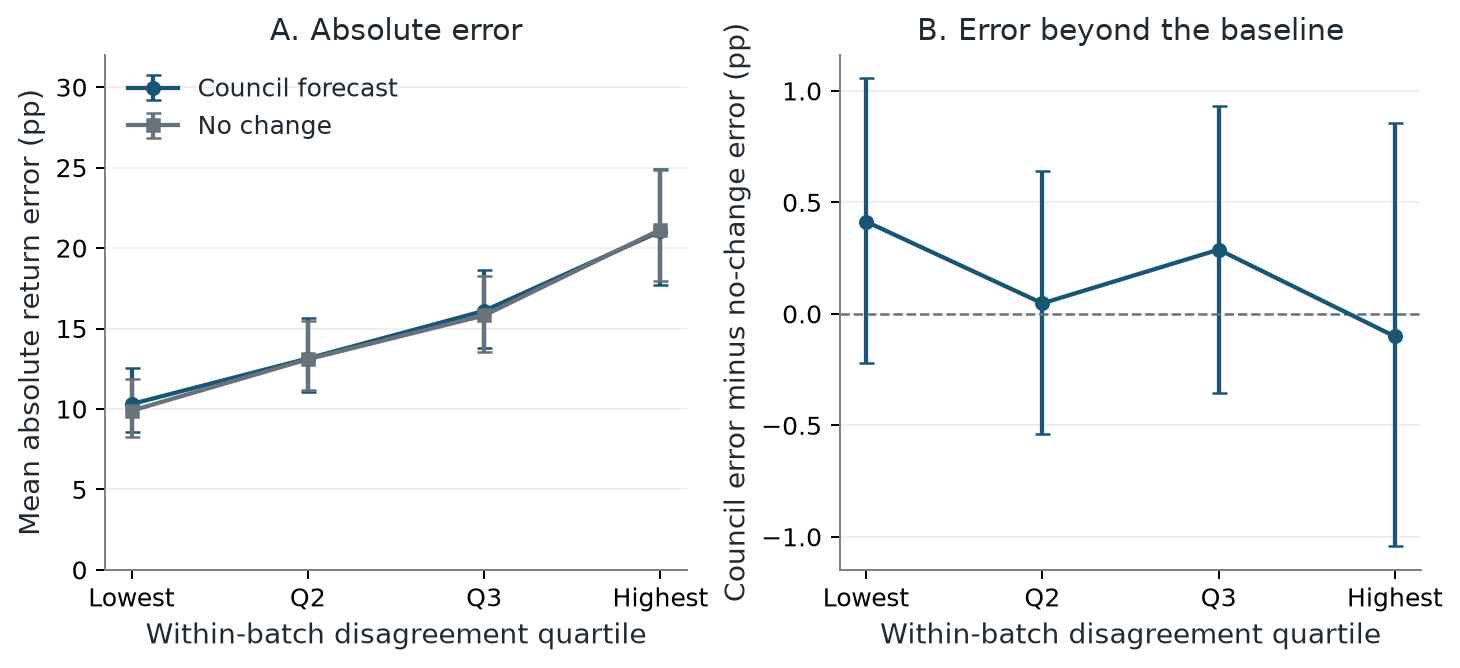
The raw disagreement–error gradient also appears for no change. Bars show pointwise 95% asset-cluster intervals.
Source: When AI Advisors Agree — Figure 3 · As of 2026-10-08
Figure from the published preprint. Pointwise asset-cluster intervals and retrospective scope are described in the paper.
The high-minus-low contrast in council error relative to no change is -0.52 points. The fixed-membership interval is [-1.74, 0.69]; recomputing within-batch ranks gives [-1.70, 0.72]. Neither resolves an added-error gradient. An unresolved effect is not proof of equivalence or that disagreement can never help.
Visible asset risk explains why some forecasts are easier
Council dispersion is closely associated with historical volatility. Within each batch, volatility is more strongly related to absolute forecast error than dispersion is. This makes ordinary asset risk a necessary comparison whenever agreement is proposed as a confidence signal.
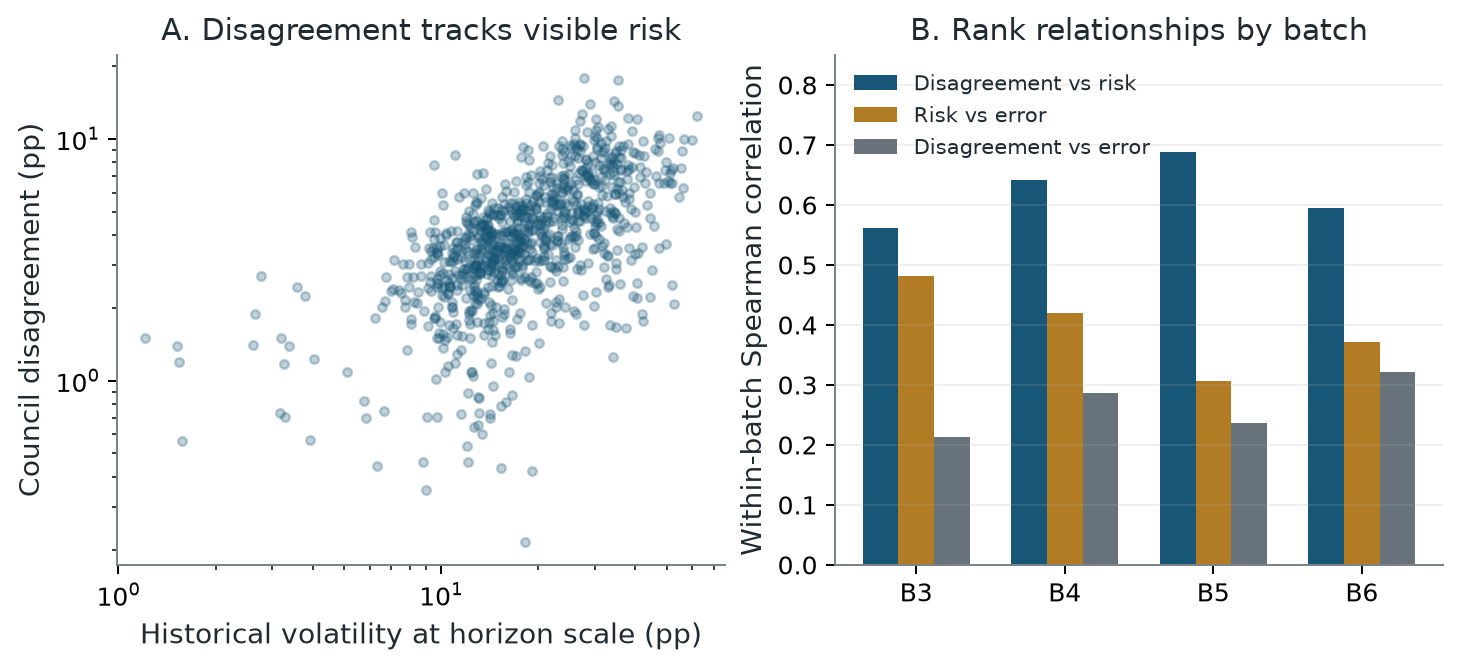
Council spread is closely related to historical volatility. Volatility is more strongly related to absolute error than spread is in each batch.
Source: When AI Advisors Agree — Figure 4 · As of 2026-10-08
Figure from the published preprint. Pointwise asset-cluster intervals and retrospective scope are described in the paper.
After accounting for historical risk, batch and asset class, the additional relationship between numerical disagreement and error remains unresolved. Comparisons within similar-volatility groups also lack a consistent added-error pattern. These results are diagnostics of this archive, rather than a causal decomposition of uncertainty.
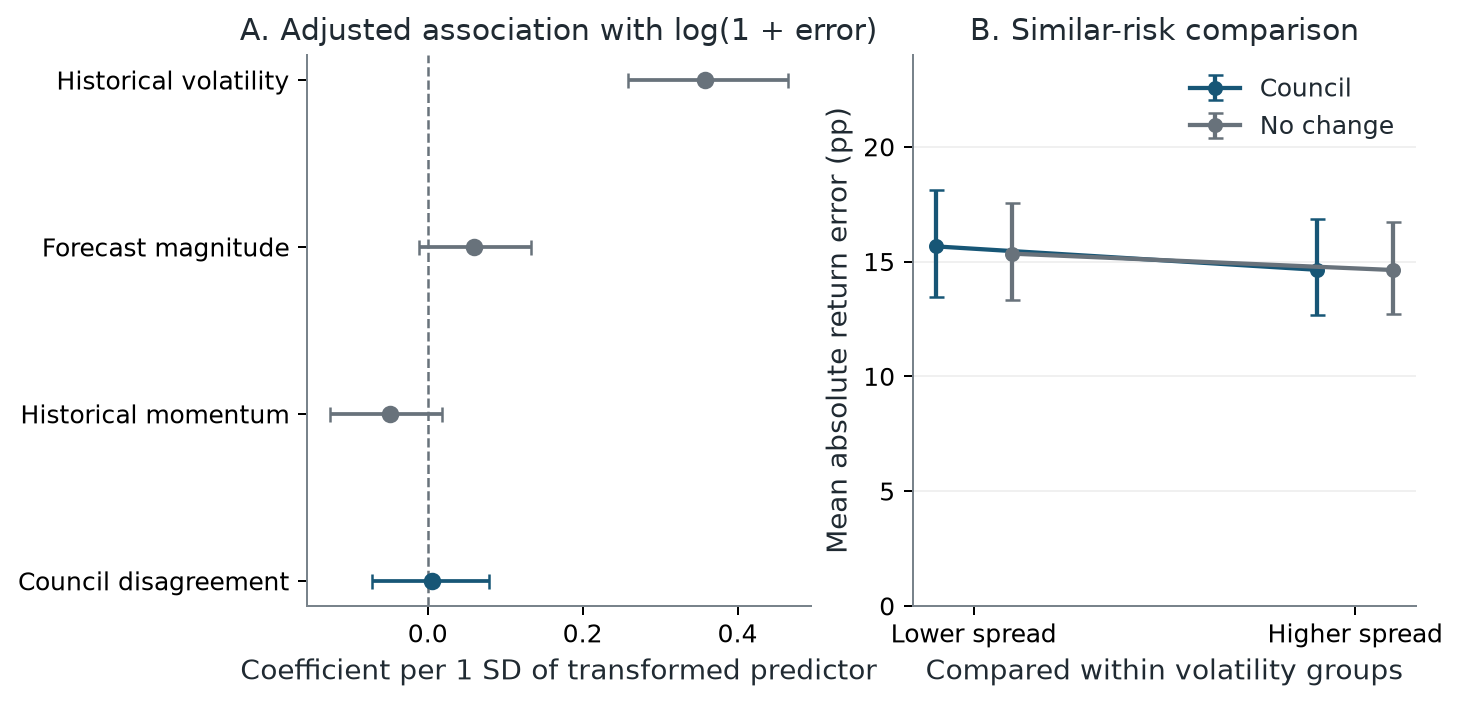
Adjusted and similar-risk comparisons. Standardized transformed predictors control for batch and asset class. Pointwise asset-cluster intervals; retrospective diagnostics.
Source: When AI Advisors Agree — Figure 6 · As of 2026-10-08
Figure from the published preprint. Pointwise asset-cluster intervals and retrospective scope are described in the paper.
Which forecasts should a system retain? Compare rules at equal coverage.
Selective evaluation asks how much error remains when a rule keeps only a fraction of forecasts. A rule that keeps very few predictions must be compared with alternatives keeping the same fraction. The study ranks forecasts within each batch, so coverage is held comparable across the four periods.
At 25% coverage, lowest historical volatility gives MAE of 7.97 points, versus 10.31 for least council disagreement. The volatility-minus-disagreement difference is -2.34 points. Its interval is [-4.26, -0.80] under fixed archived membership and [-4.34, -0.98] when each bootstrap sample recomputes selection. Both calculations condition on the same four periods.
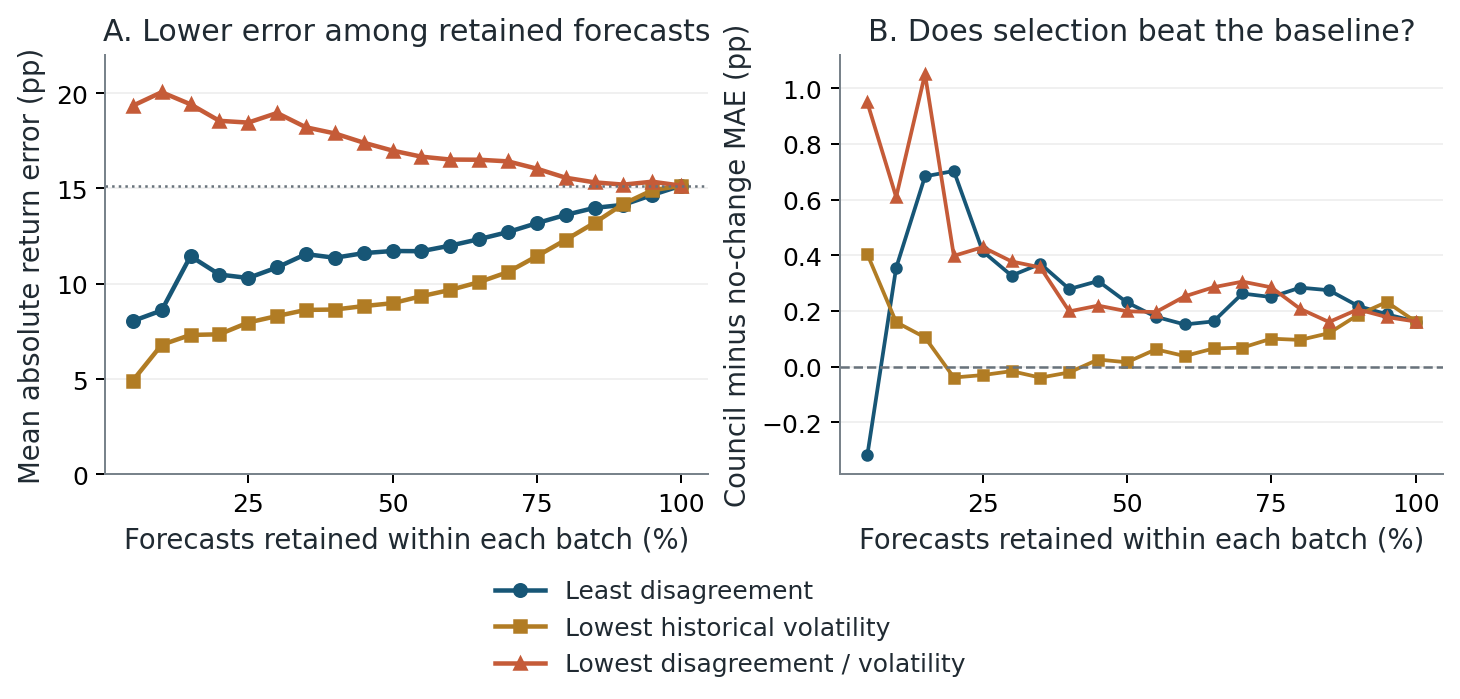
Observed error and baseline-relative error at 5% coverage increments. Curves have no uncertainty bands; recomputed-rank intervals and the Batch 3 dependence are reported in the text.
Source: When AI Advisors Agree, version 2: 05_selective_evaluation
Outcome cutoff: 8 October 2026. Revised analysis: 14 October 2026. Conditional/dependence limits are documented in the paper.
The pooled advantage depends strongly on Batch 3. Leaving that batch out reduces the selector difference to -0.02 points; omitting the other batches gives -2.66 to -3.49 points. Sector/class-block resampling gives an interval of [-5.68, -0.04], but only sixteen unequal groups and unchanged market periods are available. These checks do not establish stable prospective performance.
Direction changes when the aggregation rule changes
Strong directional agreement means at least six of seven frameworks share a direction under the paper’s up, flat and down rule. This identifies 436 outcomes; 492 have weaker directional agreement.
For the sign of the average return, accuracy is 53.21% under strong agreement and 44.11% under lower agreement. But scoring the modal framework vote leaves strong-agreement accuracy at 53.21% and raises lower-agreement accuracy to 54.27%. The apparent positive contrast disappears: the modal high-minus-lower difference is -1.06 points [-7.53, 5.30]. There are 27 tied votes; excluding them gives 55.91% lower-agreement modal accuracy. The same forecasts support different conclusions under different aggregation rules.
Raw return MAE is 16.84 points under strong agreement and 13.65 under lower agreement. Their corresponding no-change MAEs are 16.42 and 13.71. The high-minus-lower difference in baseline-relative error is only +0.48 points [-0.26, 1.23], leaving incremental magnitude skill unresolved. Larger raw error and worse baseline-relative skill are different claims.
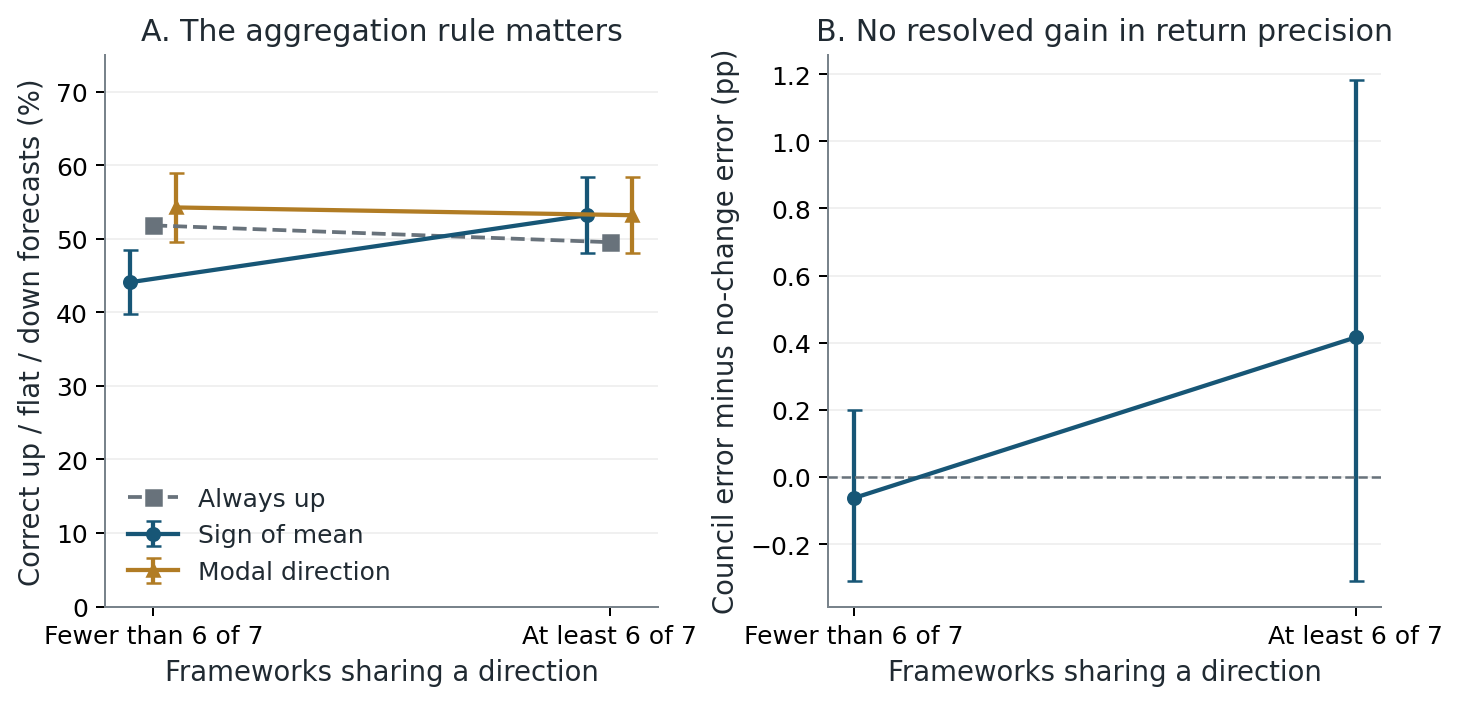
The high-agreement directional advantage is specific to the sign of the average return. Modal voting removes that positive contrast. Bars are pointwise asset-cluster intervals conditional on these four periods.
Source: When AI Advisors Agree, version 2: 07_direction_vs_magnitude
Frozen outcome cutoff: 8 October 2026. Revised analysis, 14 October 2026. See the paper for inference and replication limits.
Mean sign and the untied modal vote differ in 108 of 901 cases, all in the lower-agreement group. A large numerical forecast can change the mean when votes are split. The agreement statistic and the prediction being scored must therefore be named separately.
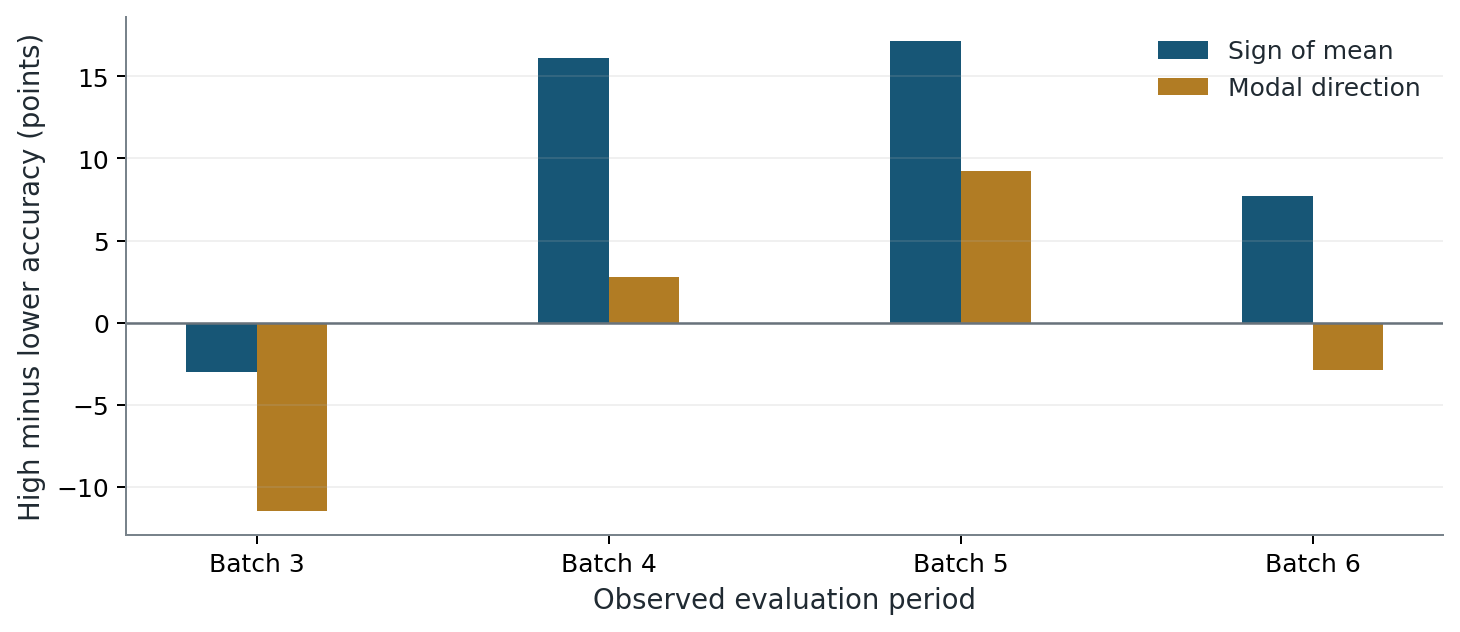
High-minus-lower agreement accuracy in each batch, separately for mean sign and modal voting. These are observed-period point estimates without uncertainty bands.
Source: When AI Advisors Agree, version 2: 10_period_direction
Outcome cutoff: 8 October 2026. Revised analysis: 14 October 2026. Conditional/dependence limits are documented in the paper.
Sensitivity checks and the limits of the evidence
The paper checks alternative aggregation and scoring specifications. Across the listed sensitivity analyses, pointwise intervals for the high-minus-low disagreement contrast in excess error span zero. The unresolved additional-error pattern is not confined to one displayed specification.
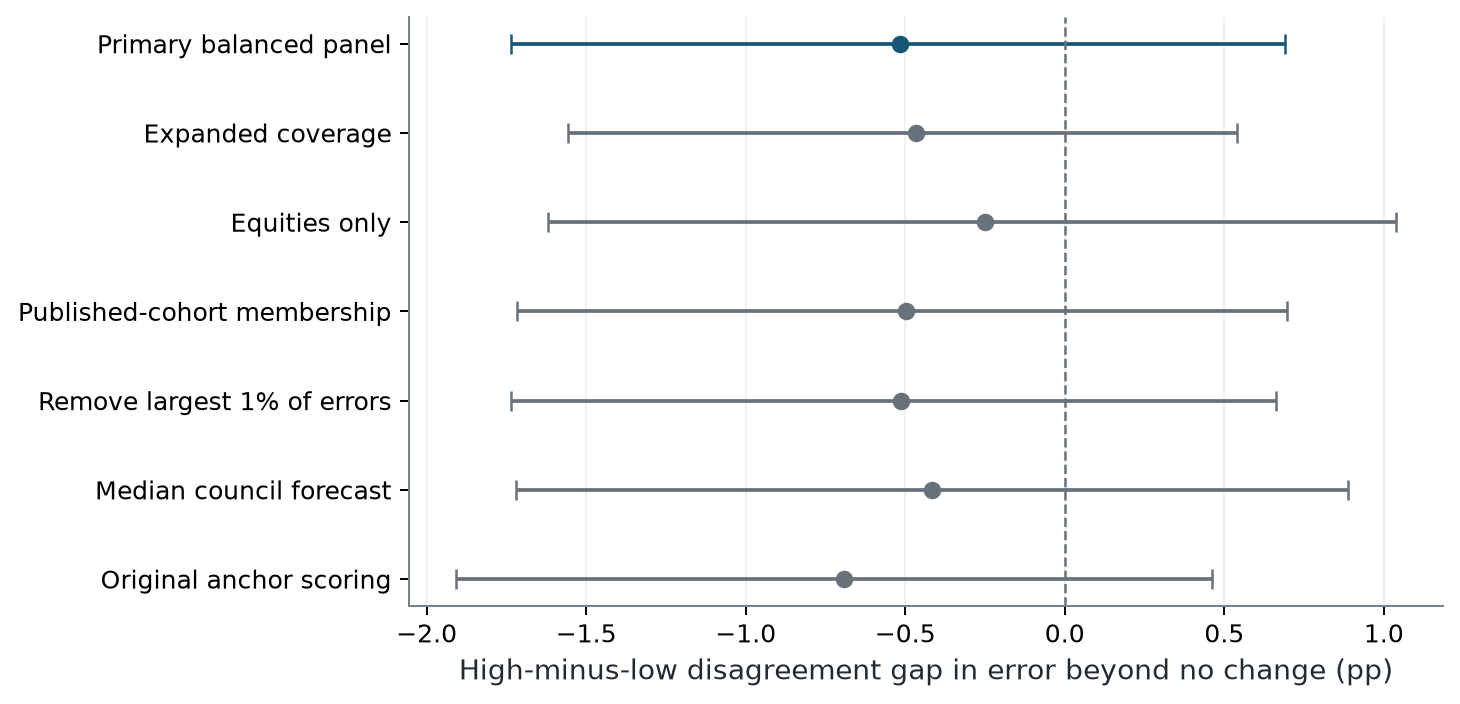
Negative values indicate a smaller council-minus-baseline error in the highest-disagreement quartile. Pointwise asset-cluster 95% intervals span zero across the listed specifications.
Source: When AI Advisors Agree — Figure 8 · As of 2026-10-08
Figure from the published preprint. Pointwise asset-cluster intervals and retrospective scope are described in the paper.
A scale-aware view and shared-model dependence
Dividing each loss by historical horizon-scale risk gives a much flatter pattern: mean scaled error is 0.722, 0.756, 0.738 and 0.767 across disagreement quartiles. Pooled skill relative to no change ranges from -4.19% in the lowest quartile to +0.48% in the highest. These descriptive values complement the percentage-point loss; they do not establish calibrated probabilities.
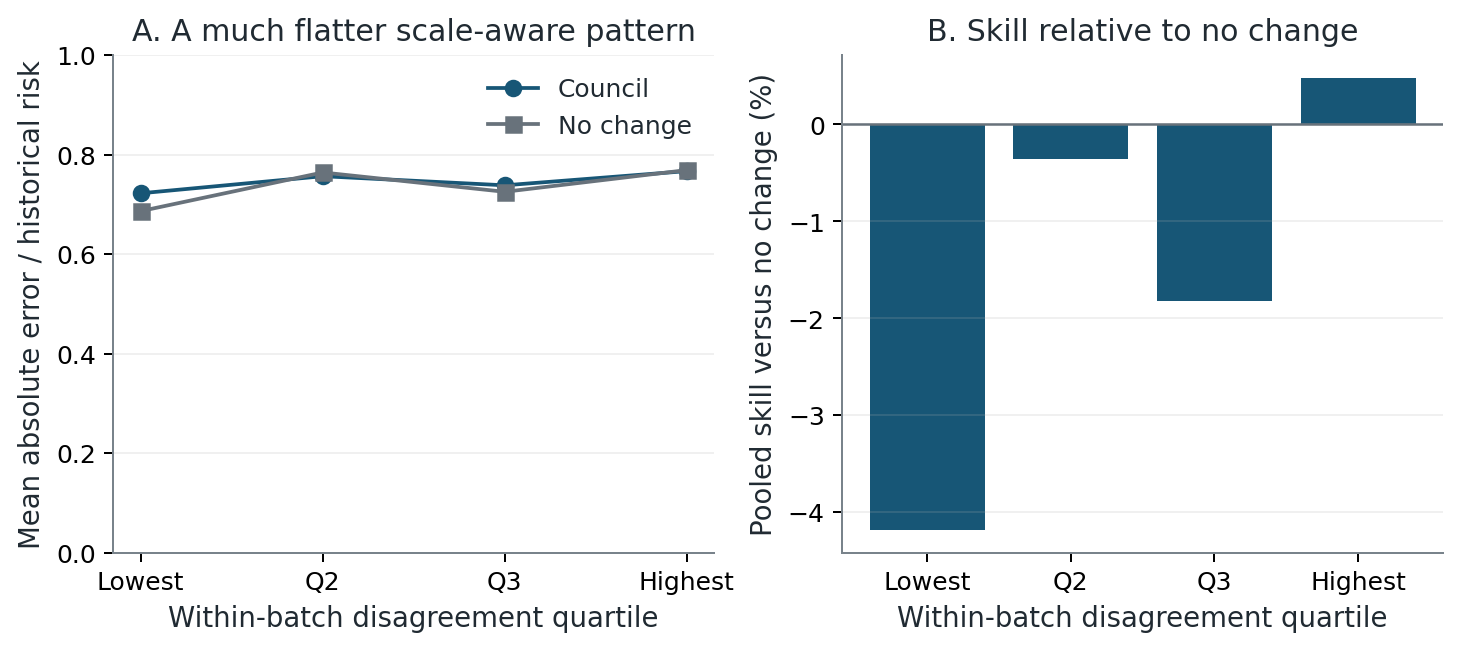
Mean error divided by historical horizon-scale risk and pooled skill relative to no change. Positive skill favors the council; descriptive estimates have no uncertainty bands.
Source: When AI Advisors Agree, version 2: 11_scale_aware_error
Outcome cutoff: 8 October 2026. Revised analysis: 14 October 2026. Conditional/dependence limits are documented in the paper.
The seven frameworks share a historical model backbone. Pooled pairwise forecast correlations range from 0.378 to 0.700 and reflect shared assets, conditions and model behavior. Averaging two modes does not halve forecast variance in this archive. Framework diversity is not provider diversity or statistical independence.
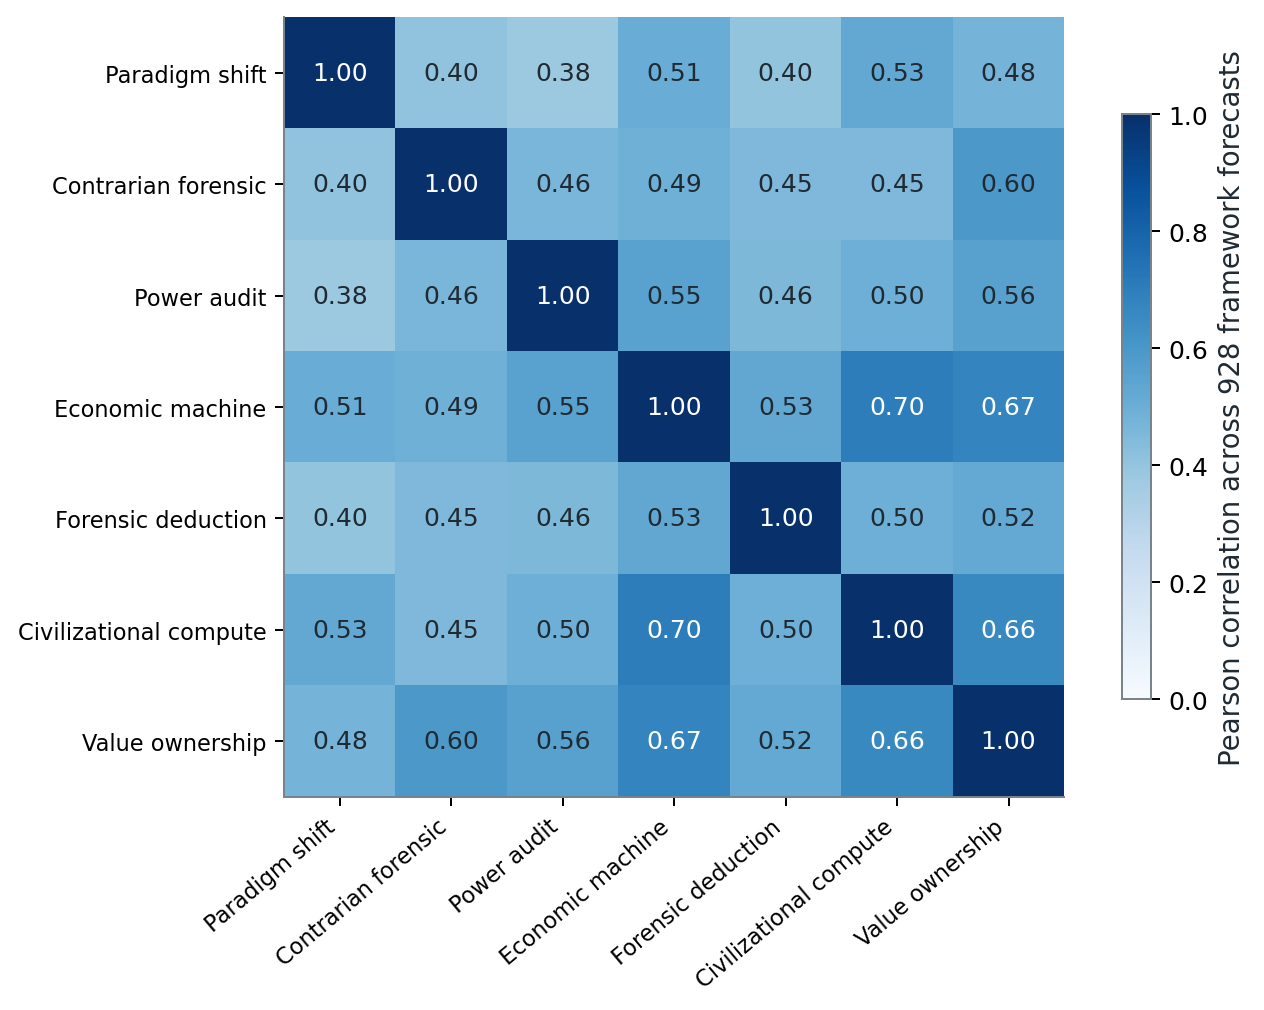
Pooled Pearson correlations among seven framework forecasts. They combine shared assets, conditions, and model behavior; they do not establish independent reasoning.
Source: When AI Advisors Agree, version 2: 09_framework_dependence
Frozen outcome cutoff: 8 October 2026. Revised analysis, 14 October 2026. See the paper for inference and replication limits.
- One platform and a shared historical model backbone: results need not generalize to other models, councils, markets or horizons.
- Only four overlapping forecast periods: asset-cluster intervals preserve repeated assets but do not fully remove common market shocks.
- Retrospective selection and data vintage: curated assets and complete-history requirements differ from a random investable-universe sample.
- Exploratory analysis: multiple secondary comparisons are not multiplicity-adjusted; unresolved effects are not proof of no effect.
- Point forecasts do not establish probabilistic calibration. Investment profitability would require a specified decision rule, costs and out-of-time evaluation.
The practical lesson: test what agreement is actually measuring
Evaluate agreement against the precise prediction and loss it is intended to support. In this archive, numerical spread largely tracks visible asset risk, and the positive directional association is specific to the sign of the average return. Majority voting changes that conclusion. Neither agreement nor a low-error selected subset establishes calibrated confidence, incremental skill, or future-regime performance.
Paper, datasets, code and citation
The public v2 companion contains 12,270 original generation-anchor configuration forecasts, cohort dates/membership for 1,227 matched records, sector/class grouping, aggregate results, the executed-analysis inventory, code, manuscript source and eleven figures. A tested market-summary adapter and recipe explain compatible input reconstruction. Licensed market-history rows and the full outcome panel remain private; author-side validation is distinguished from independent external market-data replication. Compatible recorded forecast anchors are required, rather than silently substituting another daily close.
@misc{ramdowar2026whenadvisorsagree,
  title={When AI Advisors Agree: Distinguishing Forecast Risk from Forecast Reliability},
  author={Russlan Ramdowar},
  year={2026},
  eprint={2610.13431},
  archivePrefix={arXiv},
  primaryClass={cs.MA},
  url={https://arxiv.org/abs/2610.13431}
}