For decades, Coca-Cola and PepsiCo have competed for the same place in your fridge. Coke began as a five-cent soda-fountain drink in 1886. Pepsi later made blind taste tests a centerpiece of the rivalry, reviving its decades-old Pepsi Challenge in 2025. But choosing a drink takes one sip. Choosing which shares to own for the next five years asks a harder question: which business can turn today's share price into lasting shareholder value?
The familiar red and blue labels hide very different investments. PepsiCo offers the higher dividend yield and a lower earnings valuation. Coca-Cola asks a higher price for stronger near-term guided earnings growth. Our latest published research batch strongly favored PepsiCo, yet one cautious report challenged the recovery that its more optimistic reports were counting on.
That disagreement is where this comparison starts. We test three things:
- The dividend: is the business generating enough cash to pay it?
- The price: how much future growth are investors already paying for?
- The five-year case: what would have to happen for either stock to come out ahead?
Analysis cutoff: 17 October 2026. Prices are US dollar closes for the 16 October US session. Company results, management guidance and historical model forecasts have different dates, identified below.
Same cola rivalry, different businesses
A PepsiCo shareholder owns more than Pepsi. The company also has a substantial food and snack business. Coca-Cola's concentrate and franchise bottling structure leaves different production and distribution responsibilities inside the listed company. PepsiCo's annual filing describes that mix and names Coca-Cola as a major beverage competitor.
Those differences matter when sales become cash. A business that needs less capital spending may have more left for shareholders. A broader food and drinks business can offer diversification, while requiring more investment in factories and distribution. Neither feature makes its shares a better buy at any price.
We chose these peers before inspecting their retained forecasts. This is a two-company comparison, not a search for the highest-yielding stocks or a pair with matching ratings. The large gap between their historical forecasts gives us a claim to challenge, not a result to accept.
PepsiCo's dividend: one weak half, one strong quarter
Batch 7's positive PepsiCo reports describe a recovery in demand, execution and valuation. Its lone Partially Sell report questions whether consumers will keep resisting prices and changing what they buy. If that caution proves justified, dividends and reinvestment could compete for cash. These are model-generated hypotheses; the filings must supply the facts.
Start with the cash the company actually generated. We subtract capital spending from operating cash flow. PepsiCo's own free-cash-flow definition also adds proceeds from property and equipment sales, so the table shows that adjustment separately.
Amounts are US dollars in billions (US$bn). The middle row is our subtraction of the first 24 weeks from the first 36 weeks; it is the incremental quarter, not an annual run rate. Calculations use unrounded filing amounts.
| PepsiCo period | Operating cash | Capital spending | Cash after capital spending | Asset-sale proceeds | Company-defined free cash flow | Dividends paid |
|---|---|---|---|---|---|---|
| First 24 weeks, ended 13 June | $2.37 | $1.27 | $1.10 | $0.07 | $1.17 | $3.91 |
| Incremental next 12 weeks, ended 5 September | $5.59 | $0.92 | $4.67 | $0.02 | $4.69 | $2.02 |
| First 36 weeks, ended 5 September | $7.95 | $2.18 | $5.77 | $0.09 | $5.86 | $5.94 |
Sources: PepsiCo's second-quarter SEC release and third-quarter Form 10-Q, cash-flow statements and reconciliation. Calculations: iPulse AI. Displayed rows may not add exactly because of rounding.
The first half looks worrying: cash after capital spending covered only 28.0% of dividends paid. Then the next quarter generated more than twice its own dividend requirement. By 36 weeks, company-defined free cash flow was only $78 million below dividends. Excluding asset disposals, the gap was $167 million.
That is a meaningful recovery. It also shows why stretching one weak half into a full-year prediction can mislead. Inventory, customer collections, supplier payments and taxes can shift cash between periods.
Can PepsiCo pay the dividend and still buy back shares?
PepsiCo's October earnings release retains plans for about $7.90 billion of dividends and $1.00 billion of buybacks in 2026. Subtract the free cash flow already generated, and two useful tests emerge:
| Funding objective | Full-year cash plan | Less free cash flow already generated | Additional cash needed |
|---|---|---|---|
| Dividends alone | $7.90bn | $5.86bn | $2.04bn |
| Dividends plus repurchases | $8.90bn | $5.86bn | $3.04bn |
These are our calculations, not management's cash-flow forecast. They cover the fiscal year remaining after 5 September, not an assumed 12-week fourth quarter. Without the asset-sale proceeds in PepsiCo's free-cash-flow measure, the additional needs rise to $2.13 billion and $3.13 billion.
Here is how to read the next results:
- Below $2.04 billion of additional free cash flow: that measure would fall short of the full-year dividend plan.
- Between $2.04 billion and $3.04 billion: it would cover the dividend plan, but not all planned buybacks.
- At least $3.04 billion: it would cover both plans on this measure, before considering other cash needs.
This turns the Batch 7 disagreement into something we can check. Can the recovery produce cash while PepsiCo keeps investing, or will shareholder payments keep needing help from financing and disposals?
A shortfall would not automatically force a dividend cut. Cash already on hand or borrowing can bridge a weak year. The concern grows if that bridge becomes a recurring part of paying shareholders.
Coca-Cola has a cash cushion. What does it cost?
Coca-Cola's latest available cash-flow statement covers six months to 3 July. It reports about $7.54 billion of operating cash, $0.68 billion of capital spending and $4.56 billion of dividends. Using the unrounded amounts leaves $6.86 billion after capital spending, or 1.50 times the dividend, with $2.30 billion left before other cash uses. The inputs come from its second-quarter Form 10-Q.
Coke's six months and PepsiCo's 24 or 36 weeks end on different dates. Taxes, working capital and business mix differ too. We have not annualized them into a cash-flow league table or treated coverage as a probability that a dividend will be maintained.
The positive Coca-Cola report in Batch 7 argues that its business model, pricing and international opportunities could justify a premium. Its cautious reports ask how much of that quality is already reflected in the shares. The cash cushion helps test the business case. The price tests what the shareholder pays for it.
For a common-date comparison, we divide 16 October closing prices by the midpoint of each company's guided 2026 adjusted earnings range. These are company-specific non-GAAP definitions, not identical GAAP measures or analyst consensus. Dollar figures are US$; yields and multiples use exact closes of $93.90 and $131.49 before display rounding.
Coca-Cola's outlook implies 9.00–10.00% comparable earnings-per-share growth on its $3.00 2025 base. PepsiCo's October outlook implies 2.50–3.50% core EPS growth on $8.14, below its earlier outlook. Sources: Coke's July guidance and 2025 results; PepsiCo's October release and 2025 results. Prices: Alpaca SIP daily bars.
The yields assume four quarters at the latest dividend rate, before tax, fees or reinvestment. Coke's 15 October declaration is $0.53 quarterly; PepsiCo's annualized rate is $5.92. Future dividends remain board decisions.
PepsiCo's lower multiple only helps if earnings and cash hold up. Coke's stronger business delivery only helps the shareholder if the price paid for it leaves room for a return. A good business can still be a disappointing investment when its valuation falls.
Three ways the next five years could play out
Coke has the faster near-term guided earnings growth. PepsiCo has the cheaper starting valuation. Neither fact tells us their growth rates for the next five years. PepsiCo's later guidance reduction also gives us a reason to question the September research panel's optimism.
To see what could change the outcome, start with the 2026 adjusted EPS midpoints above, apply five annual growth steps to 2031 and vary the ending price-to-earnings ratio (P/E):
| Illustrative case | Company | Annual EPS growth | Ending P/E | Five-year total gain |
|---|---|---|---|---|
| Equal growth; both multiples fall | Coca-Cola | 5.00% | 26.0× | 27.4% |
| Equal growth; both multiples fall | PepsiCo | 5.00% | 14.00× | 36.4% |
| PepsiCo earnings fail to grow | Coca-Cola | 5.00% | 26.0× | 27.4% |
| PepsiCo earnings fail to grow | PepsiCo | 0.00% | 14.00× | 11.78% |
| Coca-Cola keeps a larger premium | Coca-Cola | 5.00% | 30.0× | 45.2% |
| Coca-Cola keeps a larger premium | PepsiCo | 5.00% | 14.00× | 36.4% |
At equal assumed growth, PepsiCo comes out ahead even though both valuation multiples fall. But stop PepsiCo's earnings growth, and the comparison reverses. Let Coke keep a larger premium, and it reverses again.
That is the point of the exercise: identify which assumptions carry the result. PepsiCo needs cash and earnings recovery; Coca-Cola needs enough business progress, or a lasting valuation premium, to reward its more expensive starting price.
Formula: five-year total gain = [2026 EPS midpoint × (1 + assumed annual growth)^5 × ending P/E + five annual dividends] ÷ starting price − 1.
Batch 7 backed PepsiCo. The dissent is worth reading.
The original five-year model labels show a clear contrast:
- PepsiCo: 3 Strong Buy, 10 Buy and 1 Partially Sell.
- Coca-Cola: 1 Buy, 10 Neutral and 3 Partially Sell.
These are model labels, not votes by independent human analysts. Counting them does not tell us how likely the majority is to be right.
The stored mean annual modeled returns, including dividends, were 12.50% for PepsiCo versus 1.02% for Coke at one year, and 11.40% versus 5.29% at five years. The five-year gap was 6.11 percentage points. Price-only figures also favored PepsiCo, so dividends alone did not create the difference.
These are historical forecasts: 18 September price anchors of $129.75 for PepsiCo and $88.25 for Coke, 20 September snapshots and 21 September scoring. They predate PepsiCo's October guidance reduction. We have not moved them onto October prices or presented them as expected returns today. Batch 7 was the latest public release in the catalog checked on 17 October.
Coca-Cola: can quality keep earning a premium?
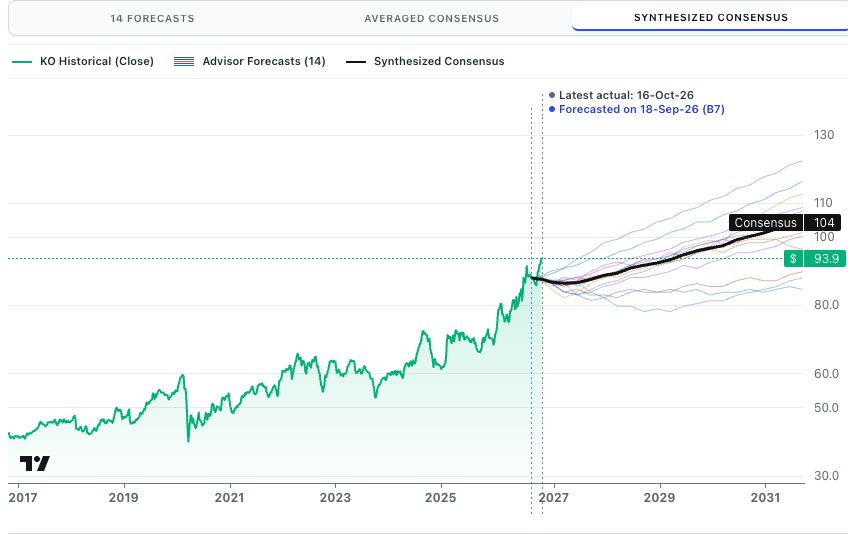
Coca-Cola: Synthesized Consensus selected; black consensus path alongside all 14 advisor forecasts. Actual iPulse AI screenshot captured 18 October 2026. Historic Timeframe controls cropped out; USD price history and September forecast dates retained. Source: https://ipulseai.com/stocks/coca-cola-ko/ai-forecasts
Source: iPulse AI live AI Opinions screenshot, captured 18 October 2026
Actual screenshot, not generated artwork. Synthesized Consensus selected; bold black consensus and all 14 advisor price paths retained. Historic Timeframe controls cropped out. USD price history and September forecast dates remain visible; no realized-return or calibrated-probability claim.
The chart shows how much the advisor paths differ around the bold synthesized consensus. The positive report argues for durable franchise economics. The caution is that even good earnings growth can produce a modest stock return if today's valuation premium shrinks. Our five-year examples show why keeping that premium could change the winner without PepsiCo's business collapsing.
PepsiCo: recovery opportunity or value trap?
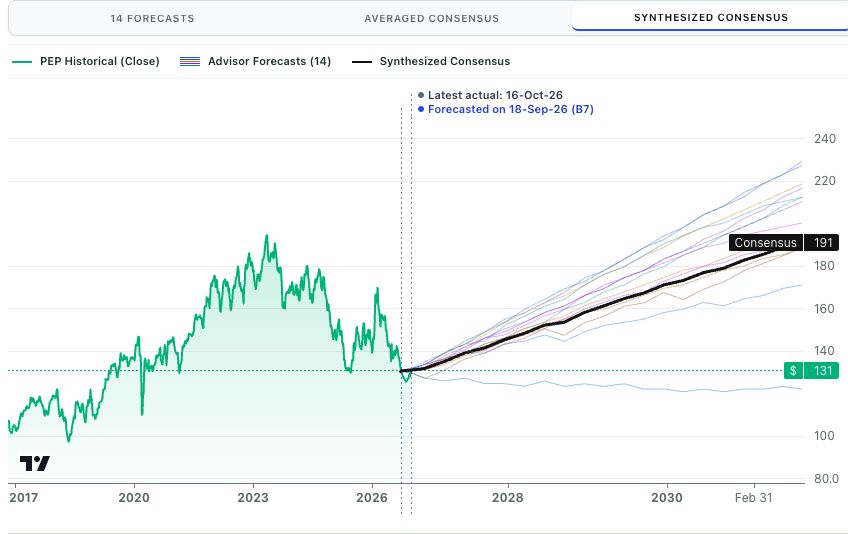
PepsiCo: Synthesized Consensus selected; black consensus path alongside all 14 advisor forecasts. Actual iPulse AI screenshot captured 18 October 2026. Historic Timeframe controls cropped out; USD price history and September forecast dates retained. Source: https://ipulseai.com/stocks/pepsico-pep/ai-forecasts
Source: iPulse AI live AI Opinions screenshot, captured 18 October 2026
Actual screenshot, not generated artwork. Synthesized Consensus selected; bold black consensus and all 14 advisor price paths retained. Historic Timeframe controls cropped out. USD price history and September forecast dates remain visible; no realized-return or calibrated-probability claim.
Most paths describe recovery, but the weaker alternative deserves attention. The cautious report asks whether soft demand and shareholder payments leave enough room to invest. The stronger third-quarter cash flow challenges a blanket bearish view. The reduced earnings outlook and remaining cash requirements keep the optimistic case conditional.
Both screenshots were captured on 18 October with Synthesized Consensus selected. The black line is the synthesized path; the lighter lines retain all 14 advisor forecasts. These are USD price paths from September, with observed prices through 16 October, not realized future returns. Live price-adjusted labels and dividend illustrations can differ from the original labels and stored annual total returns above. A synthesized path, a simple average and an individual path are different measures. Interactive views: Coca-Cola and PepsiCo.
We read all 84 base, bull and bear narratives behind the two five-year summaries. Their company numbers are not treated as verified financial facts. The four summaries use the same stored configuration, with 14 contributing tasks per company and horizon. Each company's horizons share a task set. Across the 28 unique five-year ratings, three model-version IDs are distributed 12/1/1 within each company. Shared models and inputs limit independence. The spread does not establish calibrated risk, forecast accuracy or investment performance.
What would make us change our minds?
Watch the business evidence, not just the next share-price move:
- PepsiCo's cash recovery: repeated cash generation that pays for distributions while maintaining investment would strengthen its case. Large disposals, deferred spending or recurring shortfalls would weaken it.
- PepsiCo's earnings: further pressure would challenge the recovery thesis even if the shares still looked cheap.
- Coca-Cola's delivery: sustained earnings and cash generation could justify paying a premium. Its next report also needs to refresh a cash comparison that is currently older than PepsiCo's.
- The price of quality: if Coke's premium outlasts its growth advantage, shareholders could be paying too much for resilience.
Our Verdict
PepsiCo has the more compelling long-term value case at the 16 October prices, provided its cash recovery lasts. Its lower earnings valuation and higher dividend offer a plausible route to a stronger return without needing a higher exit multiple. Repeated cash shortfalls or stalled earnings would weaken that case.
Coca-Cola is the credible alternative for investors willing to pay more for stronger reported cash coverage and faster near-term guided earnings growth. It could come out ahead if business delivery sustains its premium while PepsiCo disappoints. The risk is paying a price that already assumes too much resilience.
Batch 7 supplies the competing theses, including the minority views that could overturn the majority. Our conditional preference comes from testing those views against the filings and valuation examples, not from yield or model labels alone.
Disclosure: This article is for educational purposes and is not investment advice. It is not a recommendation to buy, sell or hold any security. Dividends, forecasts and hypothetical returns are not guaranteed; investment values can fall.