Fresh research, big ideas and conversations from iPulse AI.
AI Investment Edge · from iPulse AI
Novo Nordisk: Huge Demand, Harder Profits
Huge demand. A harder profit equation. More patients do not automatically mean stronger shareholder returns. Novo Nordisk must turn expanding access and manufacturing capacity into earnings and cash while prices, competition and research costs press in. This episode follows Novo
 Explore Novo Nordisk Investment Thesis
In This Episode
Huge demand. A harder profit equation.
More patients do not automatically mean stronger shareholder returns. Novo Nordisk must turn expanding access and manufacturing capacity into earnings and cash while prices, competition and research costs press in.
This episode follows Novo Nordisk’s ordinary B share, NOV.XETRA/EUR (ISIN DK0062498333). The reference is €34.80, the provider daily close dated 16 October 2026, refreshed on 18 October. The database updated at 21:16 Dubai on 16 October; that is an update time, not a supplied trade minute. Copenhagen’s DKK share quote and the NYSE ADR are separate references.
What Novo sells
Novo Nordisk is a Danish pharmaceutical company supplying diabetes, obesity and rare-disease medicines, including Ozempic, Wegovy and insulin products. Wegovy now includes injectable and marketed oral products; the US pill launch was in January 2026. Patients, prescribers, insurers and public health systems shape access and realized prices. Clinical research and manufacturing remain central costs.
Four financial findings
Earnings: H1 reported sales of DKK175.3bn and operating profit of DKK86.7bn include a DKK26.8bn noncash US340B rebate provision reversal. Adjusted sales were DKK148.6bn and adjusted operating profit DKK66.2bn; each grew 2% at constant exchange rates. Q2 also included DKK6.3bn of noncash pipeline impairments. Removing an accounting item does not erase its economic significance.
Margins: H1 adjusted operating margin was 44.6%. Adjusted gross margin fell to 79.3% from 83.1%, with lower prices, capacity-agreement changes and FX partly offset by productivity and product mix.
Balance sheet: June company-defined net debt was DKK86.5bn, excluding lease liabilities; cash at bank was DKK44.5bn. Cash generation, debt, research, investment and distributions must be considered together.
Investment: H1 operating cash flow of DKK79.3bn less PP&E purchases of DKK24.0bn produced DKK55.3bn of company-defined free cash flow. Payment timing and expense phasing helped. This definition changed in 2026, with comparatives restated. Annual guidance is around DKK55bn PP&E spending and DKK45–55bn free cash flow; doubling the half-year cash figure would misrepresent the outlook.
The 2026 adjusted sales and operating-profit growth outlook is −6% to 0% at constant exchange rates. September Capital Markets Day describes lower future capex intensity and broadly stable adjusted operating margins by 2030 as ambitions, not achieved results or guaranteed guidance. No freshly validated normalized P/E is supplied here.
Fixed-date price scenarios from €34.80
The September research endpoints remain 18 September 2027 and 18 September 2031—about 11 months and 4 years 11 months from this episode. Returns below are cumulative price changes, excluding dividends. These are conditional scenarios, not achieved returns or calibrated probabilities.
Evidence-weighted base: 18 Sep 2027 €43.81 (+25.9% price); 18 Sep 2031 €69.60 (+100.0% price).
Separate simple-averaged bull: 18 Sep 2027 €52.53 (+50.9% price); 18 Sep 2031 €88.72 (+154.9% price).
Separate simple-averaged middle: 18 Sep 2027 €44.72 (+28.5% price); 18 Sep 2031 €74.09 (+112.9% price).
Separate simple-averaged bear: 18 Sep 2027 €37.02 (+6.4% price); 18 Sep 2031 €48.43 (+39.2% price).
The evidence-weighted base aggregates research forecasts; its weights are not calibrated outcome probabilities. The public averaged table uses a different aggregation from the evidence-weighted base. Its displayed endpoint prices are rounded; its returns above are recalculated from those displayed prices. A positive modeled bear is not a loss floor. Volume, pricing, clinical outcomes and capacity returns can develop outside these assumptions.
Dividend cash: amounts, timing and FX
Dividends are normally unequal payments twice yearly. The latest interim was DKK3.75 per ordinary share, with a payment date of 18 August 2026; the previous final of DKK7.95 was paid on 31 March 2026. Both are already past. DKK11.70 is an unchanged annual illustration, not a declared future total.
Assuming unchanged future March finals and August interims gives one future cycle, DKK11.70, before 18 September 2027 and five cycles, DKK58.50, before 18 September 2031. At the explicit fixed ECB 16 October reference of DKK7.4748 per €1, that is €1.565259 and €7.826296 per share (about €1.57 and €7.83). Adding this assumed cash once to the weighted price endpoints gives +30.4% and +122.5% cumulative cash-inclusive base returns. These are gross before investor taxes and fees, without reinvestment and at constant illustrative FX. Future dividends and exchange rates can differ. Buybacks are separate.
What could close—or widen—the gap?
The thesis tests whether more patients and better factory utilization can outweigh net-price erosion. Drivers include oral and injectable reach, throughput and clinically supported indications. Frictions include rebates, competition, depreciation, continued research spending and country-specific loss of exclusivity. Successful successor medicines or broader access are upside tails; a major safety, regulatory or patent setback is a downside tail. Those are conditional risks, not newly announced findings.
The research disagreement is about structural pricing pressure versus a temporary period of absorbing new capacity. Fourteen September AI contributions use nine framework personas and three model versions; twelve share one Gemini version. They are correlated AI perspectives, not fourteen independent human analysts. The evidence-weighted forensic view stresses earnings adjustments and competitive limits.
Next events and clinical distinctions
Approved clinical indications and payer coverage are separate. CMS reports that the Medicare GLP-1 Bridge began on 1 July 2026 for eligible beneficiaries, subject to programme criteria and prior authorization. Novo’s H1 outlook already incorporates expected Bridge uptake. Additional access beyond those assumptions may help growth; it is not universally absent from the baseline.
4 November 2026: the next confirmed first-nine-month/Q3 results date.
Q4 2026: management expects a US FDA CagriSema decision; a decision is not approval. The latest CMD window for REDEFINE11 is Q1 2027.
Different trials: February REDEFINE4 missed noninferiority against tirzepatide 15mg in obesity at 84 weeks. September REIMAGINE5 reported favorable results against the lower 5mg dose in type2 diabetes at 60 weeks. Different doses, populations and protocols prevent a universal superiority claim.
The full 20-quarter evidence-weighted price path
Every percentage is (modeled price ÷ €34.80 − 1). These dates are model checkpoints, not confirmed company events. The table excludes dividend cash and uses full underlying precision before display rounding.
| Quarter | Weighted price (EUR) | Cumulative price return |
|---|---|---|
| 38.62 | +11.0% | |
| 39.99 | +14.9% | |
| 42.05 | +20.8% | |
| 43.81 | +25.9% | |
| 46.05 | +32.3% | |
| 48.21 | +38.5% | |
| 50.26 | +44.4% | |
| 51.82 | +48.9% | |
| 53.67 | +54.2% | |
| 55.59 | +59.7% | |
| 57.70 | +65.8% | |
| 59.27 | +70.3% | |
| 61.02 | +75.3% | |
| 62.91 | +80.8% | |
| 64.51 | +85.4% | |
| 65.41 | +88.0% | |
| 66.61 | +91.4% | |
| 67.63 | +94.3% | |
| 68.75 | +97.6% | |
| 69.60 | +100.0% |
What changed, and what would weaken the thesis?
This is Novo’s first full podcast review. July batch6 had twelve contributions and September batch7 fourteen. Original dividend-inclusive scores moved 254→240 and price-only scores 234→219, but algorithm minor versions differ, so these are not pure measures of business change. July’s debt-free wording was an analytical error corrected against filings. The last public stock episode is SpaceX EP023.
The thesis weakens if volume repeatedly fails to offset price erosion, adjusted margins and cash conversion keep worsening, new capacity earns poor returns, successor treatments disappoint, or reimbursement and patent developments shorten earnings duration. Several periods matter. Dividends do not establish a valuation floor.
Three companion conversations
Volkswagen: The Price of a Hard Reset | EP018 — Restructuring, exceptional charges and the operating test underneath. Listen on Substack · Watch on YouTube. Each recording retains its own date, industry context and forecasts.
NVIDIA: Where’s the Cash? | EP013 — Strong demand and the investment needed to serve it. Listen on Substack · Watch on YouTube. Each recording retains its own date, industry context and forecasts.
Apple: Great Business, Bad Price? | EP016 — Separating a business’s appeal from the price an investor pays. Listen on Substack · Watch on YouTube. Each recording retains its own date, industry context and forecasts.
Next: Boston Scientific. How does its medical-device growth translate into durable earnings and cash? Explore the dated Novo research and subscribe to AI Investment Edge if these conversations are useful.
Sources and production notes
Research uses the latest verified released batch7, dated September 2026, with primary company evidence checked independently on 18 October. All four released simple financial synthesis reviews were read; expert variants were unavailable. Upstream manual/source-display QA remains open. Scenarios and AI perspectives remain distinct from reported facts.
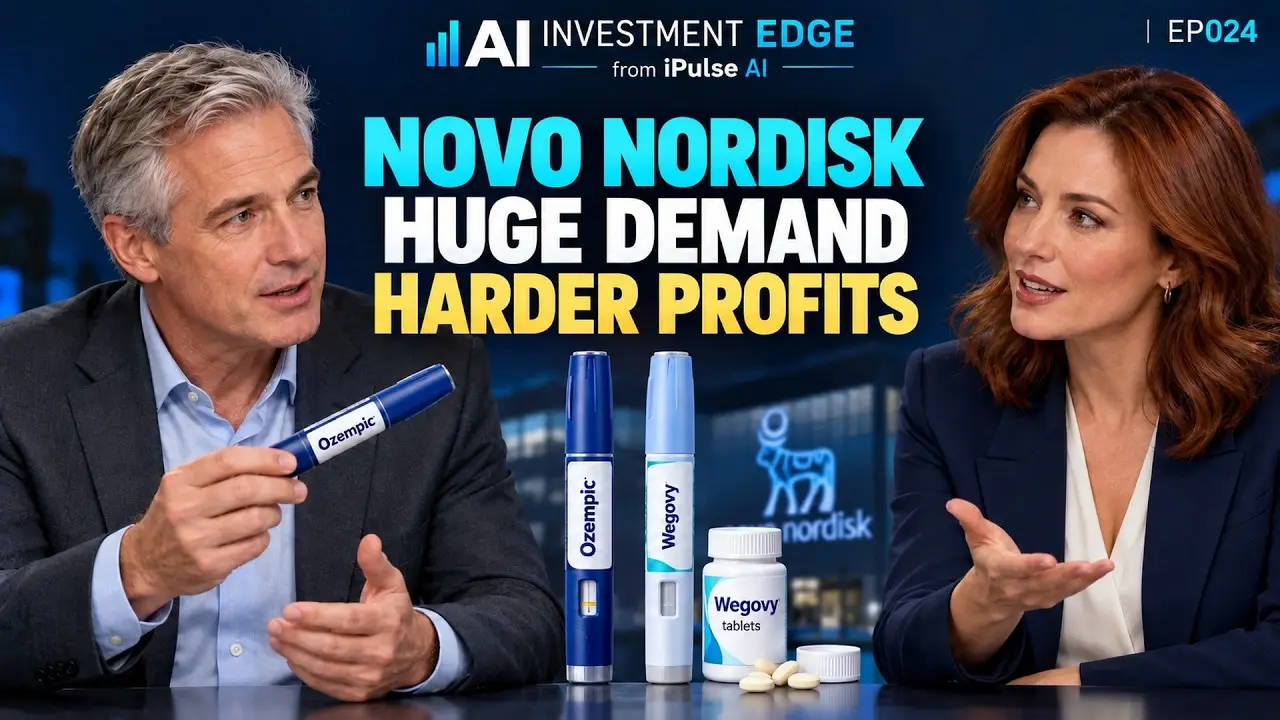
Narration uses two synthetic presenters. Cover artwork depicts fictional adult co-presenters framing a Wegovy tablet bottle and injection pens; it is an editorial illustration, not real guests, an endorsement or a clinical demonstration. Backend model and voice IDs are not disclosed by the generation service.
Full Transcript
Reviewed 18 Oct 2026 · Edited captions reviewed against the published production take. Display corrections may clarify names and figures; this is not a verbatim legal record. Select a timestamp to listen from that point. Download transcript
Full transcript · 30-second passages
Okay, let's unpack this. I mean, imagine you are running a massive blockbuster movie studio, right? They've just released the single most popular film in the entire world. Huge lines. Yeah, everyone wants to see it. Exactly. Lines wrapping around the block in every city. But there's a massive catch. To keep the audience coming, you suddenly have to build your own incredibly expensive movie theaters from scratch. Right. And while you're pouring concrete and buying projectors, you are being pressured by regulators and competitors to lower the price of your tickets.
It's a brutal dynamic. It is. So you have this unprecedented historical demand, but your costs to physically serve that demand are just skyrocketing while your per ticket revenue shrinks. We are looking at the AI Investment Edge from iPulse AI today to answer one core mission for you. How does a company translate that kind of massive patient demand into durable, profitable earnings without destroying its margins in the process? Yeah, and that tension between top-line volume and, well, bottom-line reality is the defining question for Novo Nordisk right now.
I mean, patients clearly want the medicines. Right. The demand is obvious. But the actual value of a business isn't just about how many people want the product. The critical puzzle for anyone analyzing this stock is determining how much actual economic growth Novo retains after clearing all these hurdles. The pricing pressure, the research. Exactly. Intense pricing pressure, relentless clinical research, and multi-billion-dollar capital investments into new manufacturing facilities. And we are talking about a Danish pharmaceutical giant here.
You're almost certainly familiar with their portfolio, their major diabetes, obesity, and rare disease medicines. We're looking at the massive franchises of Ozempic, Wegovy, and their established insulin products. The big ones. Yeah. And just to lock in the reality of this timeline for everyone listening, Oral Wegovy actually launched in the U.S. back on January 5, 2026. This isn't some distant catalyst sitting in a pipeline somewhere. No, it's already out there. Existing side-by-side with the injectable options.
And because those products are already in the market, the narrative has fundamentally shifted. How so? Well, we've moved past the initial hype phase of, you know, will people take these weight loss and diabetes drugs. Right. The market knows they will. Exactly. The analysis now demands a look at the hard, unglamorous numbers to see if the company is actually overcoming the friction of scale. We are looking for proof that they can handle this safely and profitably. So let's crack open those numbers because reading the headline revenue can be incredibly misleading here.
If we look at the half year ended June 30, 2026, the reported sales were a staggering 175.3 billion Danish kroner. But the adjusted sales were only 148.6 billion. That is a massive gap. It's huge, right? So the headline surge is basically an accounting picture. It's like finding a $20 bill in an old coat and counting it as your weekly salary. It doesn't actually mean you got a raise. That is a perfect analogy.
The discrepancy comes down to a very specific accounting event in the first quarter. It was a 26.8 billion kroner reversal regarding a U.S. 340B sales rebate provision. Okay, break that down for us. What is a rebate provision? So you have to realize that a rebate provision is essentially a mental rainy day fund a company creates. They estimate they'll owe certain government discounts, so they hold that value back on their books. Like setting aside money for taxes. Right. When they remeasure that estimate and realize they don't owe as much as they thought, they release it back onto the income statement.
It instantly inflates the reported revenue and profit. But, and this is the crucial part, that reversal had zero cash impact. No new cash actually entered the bank account. So if you just skim the press release, you see this massive 175 billion kroner figure and assume they sold that much more medicine. Which they didn't. Right. When you strip away that one-time accounting release, you see the actual underlying business.
And those adjusted sales only grew 2% at constant exchange rates. That really changes the temperature of the growth story. It really does. And, you know, the accounting adjustments don't stop there. In the second quarter, they recorded 6.3 billion kroner in non-cash pipeline impairments. Wow. Where did that come from? Well, 4.0 billion of that came just from monlunabant. An impairment means the company looked at an asset they were developing, realized its future economic value is significantly lower than they originally modeled, and took a write down.
So, again, no cash actually left the building today. Correct. But it is a direct hit to the long-term investment record of their research and development. So, to find the true adjusted operating margin of 44.6%, you have to back out that massive positive rebate reversal and add back those impairment charges. Because those underlying costs are so high and the net price is under pressure, we really have to scrutinize what's actually surviving to the bottom line.
And that gross margin story is where the friction is, like, most obvious. Yeah, it dropped. Right. We went from an adjusted gross margin of 83.1% in the prior first half down to 79.3% in this current first half. That is a meaningful compression for a company operating at this scale. That drop is the numerical manifestation of the headwinds we just discussed. It reflects net price pressure, fierce market competition, the evolving mix of products being sold, and heavily the depreciation costs kicking in from all their manufacturing expansion.
And funding that expansion requires significant leverage, right? Absolutely. The balance sheet shows a company-defined net debt of 86.5 billion krona. Okay. And that figure already subtracts the 44.5 billion they have sitting in cash at the bank, meaning the remaining financing burden is still substantial. Which shatters any illusion that this is just some mature cash cow business coasting on its patents.
I mean, they are building the airplane while flying it. Completely. The first half free cash flow was 55.3 billion kroner, but they are guiding for around 55 billion in property, plant, and equipment spending for the full year alone. They are pouring their cash right back into the ground to build these factories. The capital intensity is relentless. We actually discussed a very similar accounting dynamic in our companion deep dive on Volkswagen, EP018. Oh, right. The CapEx stuff.
Exactly. You always have to separate the reported headline accounting charges from the underlying operating reality. The capital expenditures dictate the future far more than a one-time rebate adjustment. So, let's transition from how the company is performing internally to how the market is actually pricing that performance today, because the spread of opinions here is wild. It's all over the place. We are looking at the specific research security for the Novo Nordisk Ordinary B share, traded as NOV.XETRA in euros.
The reference price from the October 16, 2026 close is 34.80 euros. From that starting line, the September weighted base price path models a cumulative appreciation of plus 25.9% by September 18, 2027, and a clean plus 100.0% by September 18, 2031. But before we go further, we must define what a weighted base path actually is in these models.
It aggregates various research forecasts using evidence weights. Which means? It is vital to understand that an evidence weight is not a calibrated mathematical probability. It does not mean there is a 100% chance or even a highly probable chance of hitting that exact number. It is simply an aggregation of the analytical conviction at this specific moment in time. So, what does this all mean for the dividends? And we need to be careful not to mistake evidence weights for a magical crystal ball probability, right?
Right. There are absolutely no probabilities attached here. Just like with the alternate scenarios provided in the research. Yeah, the simple averaged bull case implies returns of plus 50.9% for 2027 and a massive plus 154.9% by 2031. But the bear case projects only plus 6.4% for 2027 and plus 39.2% for 2031. Neither of those have assigned probabilities either. But that massive spread between a 39% gain and a 150% gain tells us the market is incredibly divided on whether these multi-billion dollar factory investments will actually pay off.
So, the market is fundamentally debating the terminal value of the stock. Exactly. But while that debate rages, there is direct numerical accounting for the cash actually returning to investors right now via dividends. Let's walk through the math. Okay. Let's do it. Novo paid a final dividend of 7.95 kroner on March 31st, 2026.
And an interim dividend of 3.75 kroner on August 18th, 2026. So, together that equals 11.70 kroner annually. Right. And if you simply project that flat amount forward over five future cycles to our September 2031 endpoint, you get 58.50 kroner. Now, to make that comparable to our 34.80 euro share price, we have to run the exchange math. Using a fixed illustrative exchange rate from mid-October, where 1 euro equals roughly 7.4748 Danish kroner, that annual cash stream converts to 1.57 euros per share before the 2027 endpoint and 7.83 euros per share before the 2031 endpoint.
And if we add those exact cash amounts directly to the weighted terminal prices, we arrive at a cumulative cash-inclusive base return of plus 30.4% for 2027 and plus 122.5% for 2031.
But we have to be super clear on what that actually means. We must be incredibly disciplined about what that calculation represents. It is purely gross before any taxes or portfolio fees. It assumes absolutely no reinvestment of those dividends over the five years. Right, no compounding. Exactly. Furthermore, there is zero yield rhetoric here. We are not arguing the stock is a good income play. We are just demonstrating the straight arithmetic of adding the generated cash per share to the projected terminal price to understand total possible return.
Okay, now that we have the math laid out, we need to understand the gears actually turning the machine. The research categorizes the fundamental mechanisms driving the stock into four quadrants. The driver, the friction, the upside tail, and the downside tail. Right. The driver is fairly straightforward. It's the push for broader oral and injectable patient reach and increasing the sheer throughput of their factories. But the complication within that driver is the gap between a drug receiving an approved clinical indication and a patient actually getting insurance coverage for it.
A clinical indication simply means a regulatory body agrees the drug works safely for a specific condition. It's a scientific baseline. But payer coverage relies on program rules, patient eligibility, and brutal commercial negotiations. Here's where it gets really interesting. I always think of it like getting your driver's license. Having a clinical indication is like getting your driver's license.
But payer coverage is finding out if someone else is actually going to pay for the car. They are not the same thing. Getting the FDA's blessing doesn't magically force an insurer to open their checkbook. That's spot on. Approval, reimbursement, and commercial success are distinct steps. And that reality feeds directly into the friction quadrant. Right. To secure that payer coverage, Novo has to accept lower realized prices and offer massive rebates. Add in the fierce competition from Eli Lilly and the heavy depreciation costs from all those new factories,
and you see why revenue growth doesn't seamlessly translate into profit growth. So let's clarify the extremes, the tails. The research strictly defines the upside tail as a successful breakthrough successor medicine, like a next-generation treatment that massively exceeds both clinical and commercial expectations. And we should be very clear here. The Medicare GLP-1 bridge that began on July 1, 2026 is already baked into the baseline assumptions. It's not the upside.
No, it is not an upside tail event. Current payer access is baseline. The market already expects that uptake. An upside tail must be conditionally new. And the downside tail? That represents a structural break in the thesis. This would be strictly an unexpected major safety or regulatory restriction, or an adverse patent or generic outcome that suddenly truncates the lifespan of their highly profitable revenues. So all of these forces pushing against each other create what the research calls the alpha gap.
It's the tension between the unprecedented patient demand on one side and the sinking net prices and billions in infrastructure costs on the other. It's like a massive scale. Exactly. Does sheer volume automatically equal value for the listener's portfolio? If we connect this to the bigger picture, the historical answer to that is no. Lower product prices do not automatically create shareholder value unless the pure volume of new patients and the manufacturing efficiency of the new factories completely overwhelm the price erosion.
Building a state-of-the-art facility only creates value if the commercial returns over the next decade justify the resources you incinerated to build it today. We actually explored a mirror image of this dynamic in our NVIDIA EP-013 companion deep dive. You have world-changing, undeniable demand, but you have to weigh it against the sheer mountain of cash required to build the infrastructure to actually serve it. And because that alpha gap is so wide, the underlying AI models analyzing Novo stock are completely fractured in their conclusions.
I mean, we are looking at a September batch of 14 different AI research contributions. These utilize nine framework personas and three model versions, with 12 of them sharing a specific Gemini version. It's fascinating because it proves that AI isn't just this monolith. It's like having a room full of brilliant analysts looking at the exact same factory and arguing whether it's a gold mine or an expensive money pit. That's exactly it. Because they are correlated AI perspectives weighing variables differently, not 14 independent human minds.
The core philosophical divide among the models is whether Novo Nordisk is facing permanent structural price pressure that will permanently impair margins, or if they're simply navigating a temporary painful period of absorbing the costs of their new capacity. Right. The models that lean heavily on forensic analysis, particularly the higher weight polymath framework, focus intensely on the quality of earnings. They zero in on the 340B accounting adjustment we discussed. And they enforce realistic limits on competitive market share,
rather than just extrapolating endless, unconstrained patient demand into the 2030s. So they do agree on the demand, though? Directionally, yes. Everyone broadly agrees demand is huge. The disagreement revealed by the evidence weights is entirely about margins, timing, and what terminal multiple the market will assign to a capital-intensive drugmaker. Well, since there is so much disagreement, we need a timeline to track which models are actually predicting reality. The research gives us a 20-quarter weighted PATH model.
From our 34.80 euro anchor, the modeled cumulative price checkpoints are plus 11.0% by December 2026, plus 14.9% by March 2027, plus 20.8% by June 2027, and plus 25.9% by September 2027. But we have to be incredibly careful here. Right. So if I'm marking my calendar, I need to know that the model's check-ins in December or March aren't necessarily the days Novo is releasing a big study.
This raises an important question. You must strictly separate the AI model's arbitrary checkpoints from the company's real-world operational calendar. The model dates are just quarterly check-ins for the algorithm. The actual business catalysts happen on their own schedule. So what are the actual real-world dates? Novo's Q3 results arrive on November 4, 2026. They are awaiting a U.S. FDA decision on CagriSema in Q4, 2026. And remember, a decision is not a guaranteed approval.
After that, the Redefine 11 clinical readout window lands in Q1, 2027. And when those clinical readouts drop, we have to look past the headlines, success or failure, and read the deep clinical nuance. If we look back at the recent trials, Redefine 4 and Reimagine 5, they tell totally different stories. They answer entirely different medical questions. In February, Redefine 4 missed non-inferiority against the maximum dose of tirzepatide in obesity patients.
But in September, Reimagine 5 reported favorable results against a lower dose of tirzepatide in type 2 diabetes patients. So totally different parameters. Yes. The patient population, the dosage, and the primary endpoint dictate the commercial reality. Whenever new primary clinical announcements happen, they immediately supersede the old archived assumptions in the models. Which brings up a great point about navigating the archived research. If the algorithms update their frameworks between the July batch of analysis and the current September batch, how do we confidently track the narrative without getting lost in the technical changes?
You have to separate a shift in methodology from an actual shift in the business. The algorithm's minor versions differ between the July and September reports, meaning there is no direct like-for-like comparison. Got it. For instance, the July analysis contained a mention of Novo being debt-free. That was a pure analytical error by the model, which was subsequently corrected against the actual balance sheet filings in later runs.
Novo did not magically pay off tens of billions in debt overnight. Right. It requires discipline to keep our eyes on the core business problem. It actually reminds me of the last publicly listed stock we covered, SpaceX, in episode 023. It's obviously a totally different industry, building rockets versus formulating pharmaceuticals, but the fundamental tension is identical. The parallel is very strong. Different industries, same fundamental question of funding growth. Having a phenomenal product does not make a company immune to the laws of capital expenditure.
Exactly. We covered this from another angle in our Apple EP016 deep dive. Great business, bad price. A company can be universally admired, but the price you pay for the equity today, weighed against the capital required to maintain its dominance, ultimately dictates your return. Okay, we've mapped out the upside, the intense demand, and the margin compression. Let's look at the breaking point. Okay, we've looked at the upside, but what actually breaks this whole thesis for you? What is the true invalidation point?
The thesis collapses if a few specific substantive triggers occur. First, if greater patient volumes repeatedly fail to offset the ongoing pressure on realized prices. So if scale doesn't fix the pricing drop. Right. Second, if adjusted margins and cash conversion metrics consistently worsen quarter over quarter, proving the friction is structural rather than temporary. Third, if this massive build-out of new factory capacity ultimately earns poor commercial returns.
And obviously, if the science fails them. Precisely that. If the next generation's successor treatments disappoint in clinical trials, the future growth premium vanishes. Or if drastic reimbursement changes or adverse patent developments prematurely kill their durable earnings window. It's a lot of moving parts. It is. And crucially, it takes multiple periods of evidence to distinguish between a one-off accounting adjustment, like that 340B reversal, and a true structural decline in daily operations.
And we shouldn't lull ourselves into a false sense of security with the dividend, right? Because if the core business degrades structurally, the dividend isn't going to save the valuation. The dividend is a mechanism of capital return, not a safety net. It does not create a guaranteed valuation floor if the fundamental earning power of the company is permanently impaired. So synthesizing everything we've uncovered today, we set out to figure out how Novo Nordisk handles the friction between massive demand and massive expansion costs.
The core takeaway is that while the patient demand is undeniable, generating sustainable profits requires the company to successfully defend its margins, earn high returns on its new manufacturing facilities, and actually generate free cash after all the heavy investments are paid for. The exact arithmetic, the valuation scenarios, and the companion episodes we referenced all highlight the sheer tension between top-line revenue growth and the bottom-line reality of funding that growth.
It's the movie theater problem. The blockbuster is playing, but we have to see if building the theaters actually leaves any money in the register. You can inspect the dated research and the full 20-quarter path at iPulseAI.com. Listen or watch our Volkswagen, NVIDIA, and Apple conversations for three other views of capital and valuation. Subscribe to AI Investment Edge if these discussions are useful. Next is Boston Scientific. How does its medical device growth turn into durable earnings and cash?
So as you watch this industry evolve, ask yourself, when you see massive demand for a product, are you looking at the volume of users or the cost of the factories required to serve them?