Company research and market ideas, in conversation.
AI Investment Edge · from iPulse AI
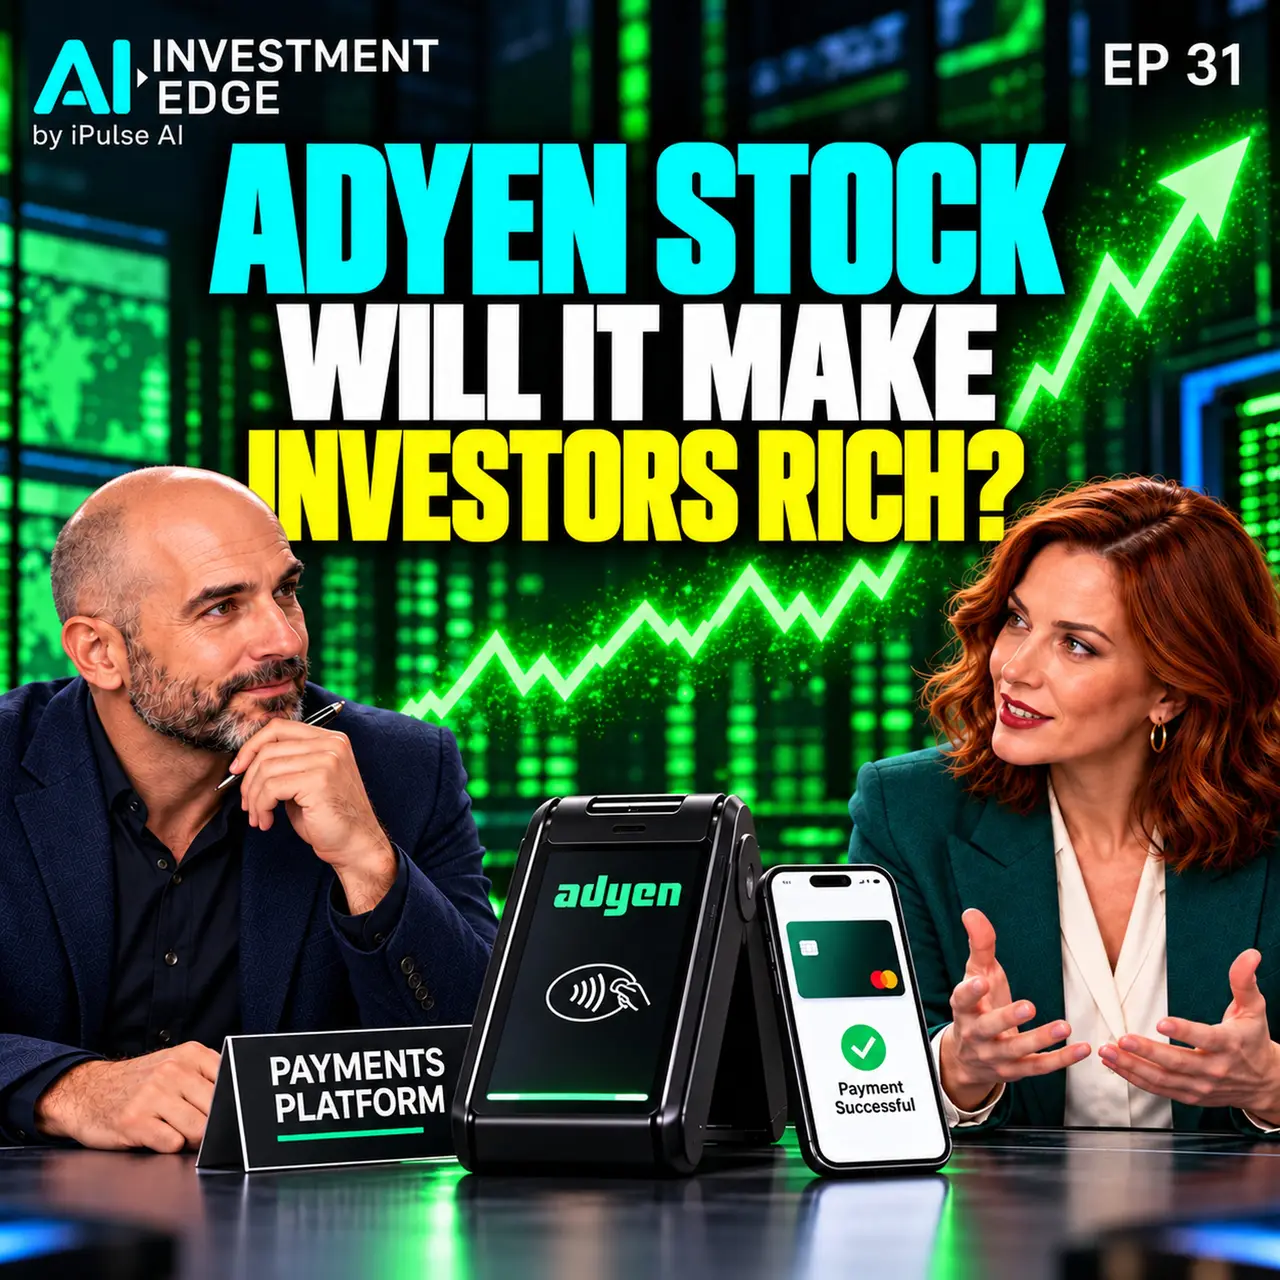
EP 31 | Adyen Stock Analysis: Will It Make Investors Rich?
Research as of 26 Oct 2026
Adyen stock analysis: will its global payments platform make investors rich? Growing payment volume is only the beginning. The question is what lasting cash reaches shareholders after pricing pressure, investment and merchant settlement obligations. Adyen connects online and in-s
In This Episode
EP 31 | Adyen Stock Analysis: Will It Make Investors Rich?Adyen keeps a small share of a very large flow of commerce. Could its integrated payments platform turn merchant growth into substantial investor wealth? The answer depends on profitable expansion, a realistic starting valuation and the cash left after investment and settlement obligations.
Explore Adyen's research
Current weighted view: BUY at the 1Y and 5Y horizons; immediate platform label BUY & KEEP. Checked October 26, 2026 for the ordinary ADYEN.AMS listing in EUR, ISIN NL0012969182. These labels use the public evidence-weighted fixed-target method on the October 23 EUR945.40 closing basis. Individual Strong Buy opinions and the daily all-advisor mean use different inputs or aggregation and do not replace this consensus.
The business and four financial findings
Adyen supplies end-to-end payment processing, authorization, risk tools, acquiring and settlement for large merchants and software platforms. Digital, Unified Commerce and Platforms connect online and in-store commerce. A consumer wallet or device interface operates at a different layer from the merchant's acquiring infrastructure. Payment volume measures money processed, rather than Adyen's revenue.
- Earnings and financial trend: H1 2026 net revenue was EUR1.30bn, up 19% reported and 21% at constant currency. Processed volume rose 24% to EUR803.80bn, while net income rose 13% to EUR544.06m. Platforms volume increased 42% and net revenue 37%. Mix can lower blended revenue per payment while absolute revenue grows, but it does not establish that pricing pressure is absent.
- Profitability and margins: EBITDA was EUR641.54m and its margin 49%, or 50% excluding EUR6m transaction costs. Operating profit was EUR564.34m, a derived 43.31% margin on net revenue. Finance income of EUR143.23m sits below operating profit and EBITDA. Management's above-55% goal for 2028 is an EBITDA-margin objective. People, technology, depreciation and compliance remain costs as the platform scales.
- Balance sheet and leverage: Reported June cash of EUR12.39bn includes settlement funds. Subtracting EUR8.10bn merchant payables and adding EUR602.81m merchant receivables yields EUR4.90bn under the company's adjustment, approximately EUR4.60bn pro forma net of the acquisitions. This is not all freely distributable shareholder cash. No funded bank-debt line appears in the balance sheet, while leases, merchant obligations and regulatory capital remain relevant. Current assets divided by current liabilities give 1.65 times at June 2026 and 1.72 times at December 2025. The anomalous 168.11-times display is not used.
- Capex and investment intensity: H1 company-defined capex was EUR64.05m, approximately 5% of net revenue. The full-year plan increased to about 7%, pulling 2027 data-center compute and storage purchases into H2 2026. Future normalization is an expectation to test, rather than a promise that infrastructure spending ends.
One cash bridge, with its actual definition
| Component | EUR million |
|---|---|
| EBITDA | 641.54 |
| Less company-defined capex | 64.05 |
| Less lease payments excluding interest | 24.13 |
| Company-defined FCF | 553.36 |
This produces approximately 86% conversion of EBITDA. The measure is before cash taxes and working-capital movements. It differs from statutory operating cash flow minus capex. Statutory H1 operating cash flow of EUR2.28bn included EUR1.73bn of merchant-payable working-capital inflow, which is not recurring corporate earnings.
Valuation after counting each half-year once
H2 2025 net income of EUR581.56m plus H1 2026 net income of EUR544.06m gives EUR1.13bn trailing earnings. The two disclosed diluted half-year EPS amounts total EUR35.58. Dividing the recording's dated EUR945.40 reference by that approximate trailing EPS gives 26.57 times, or roughly 27 times in conversation. The newer EUR947.10 trade described below gives 26.62 times on the same reconstruction. This reconstruction avoids double-counting semiannual periods. A low-teens P/E or a claimed 10% cash yield repeated in some narratives is not the basis of this thesis.
The simple historical chart uses annual non-IFRS EBITDA: 2021 EUR629.99m, 2022 EUR728.29m, 2023 EUR743.04m, 2024 EUR992.31m and 2025 EUR1,245.75m. The 2025 annual report supplies the current values and exact annual-change table used to reconstruct earlier levels. Annual EBITDA is separate from H1 2026, operating profit and net income.
Current reference and fixed model endpoints
The recording uses the October 23, 2026 closing reference of EUR945.40, independently confirmed on Euronext. A later finalization check found EUR947.10, last traded October 26 at 14:37 CET, on the Euronext Adyen market page. This intraday trade is separate from the recording and the current rating's closing basis. It updates the return illustration below without implying a new model run or rating. The research was released September 21, with a September 20 financial-evidence cutoff. Its original September 18, 2027 and September 18, 2031 endpoints remain fixed, approximately eleven months and just under five years from this recording.
| Reference or fixed horizon | EUR per share | Cumulative price return | Assumed ordinary cash dividends per share |
|---|---|---|---|
| October 26, 2026, 14:37 CET trade | 947.10 | 0% | Not applicable |
| 1,108.10 | +17.00% | EUR0 | |
| 2,193.21 | +131.57% | EUR0 |
Adyen's current policy is not to pay dividends. The illustration assumes EUR0 future ordinary cash dividends at both endpoints, so no cash-dividend uplift is added. It excludes tax and fees and assumes no reinvestment or FX conversion. A future board decision could change the policy.
- Bull mechanism: merchant expansion and useful cross-selling produce profitable revenue growth while investment intensity eventually eases. Earnings, rather than a necessary return to a speculative valuation multiple, support compounding.
- Bear mechanism: lower fee yield, slower demand, integration costs, persistent infrastructure spending and reduced finance income weaken cash returns while valuation compresses. Positive model endpoints are not a price floor. The individual advisor range uses a different construction and is not a weighted bull/bear distribution.
Drivers, frictions and both tails
- Core drivers: greater share of merchants' payment flows, online/in-store integration, Platforms growth and operating efficiencies.
- Core frictions: customer bargaining power, competition, consumer demand, regulation and technology investment. Switching costs are useful but not insurmountable.
- Distinct upside tail: agent-directed and machine-to-machine commerce becomes a material profitable payment channel, or an unusually large migration from legacy processors accelerates growth. Dominant protocol status is a scenario, not an established result.
- Distinct downside tail: a serious breach or prolonged platform outage damages trust and merchant retention. Alternative rails or major regulatory changes could impair fee economics. No such breach, outage or zero-fee mandate is asserted here.
The alpha-gap hypothesis and disagreement
The research argues that some investors may confuse lower blended payment basis points and frontloaded investment with permanent deterioration. The counterargument is that weaker pricing power, integration and future spending justify caution. Neither interpretation is established by volume growth alone. Evidence must show revenue quality and cash after the relevant costs.
Fourteen AI contributions span nine analytical frameworks and three model versions, with twelve using the same Gemini version. They are correlated AI perspectives. Disagreement concerns mix versus pricing, the duration of investment and the returns on acquired software. Some heavily weighted reports challenged duplicated financial data, but primary-source checks remain necessary for their claims too.
The full quarterly path and actual events
Each row is a model scenario checkpoint, not an achieved price, scheduled company event or promised operational milestone. The first target is below both dated references; the path returns above it in Q1 2027. Rationale about later spending normalization and profitable scale remains a research hypothesis.
| Fixed model window | Target EUR | Cumulative price return |
|---|---|---|
| 919.54 | -2.74% | |
| 976.37 | +3.28% | |
| 1,033.58 | +9.33% | |
| 1,108.10 | +17.21% | |
| 1,164.39 | +23.16% | |
| 1,236.59 | +30.80% | |
| 1,279.25 | +35.31% | |
| 1,357.67 | +43.61% | |
| 1,420.39 | +50.24% | |
| 1,504.90 | +59.18% | |
| 1,544.03 | +63.32% | |
| 1,624.32 | +71.81% | |
| 1,672.89 | +76.95% | |
| 1,762.22 | +86.40% | |
| 1,820.02 | +92.51% | |
| 1,897.01 | +100.66% | |
| 1,968.15 | +108.18% | |
| 2,053.76 | +117.24% | |
| 2,114.55 | +123.67% | |
| 2,193.21 | +131.99% |
The next confirmed event is the October 28, 2026 Q3 business update. It remains future at this recording. H2 2026 results are scheduled for February 11, 2027.
What changed and what would change the view
July's comparable research emphasized the integrated stack, a harvest after heavy hiring, interest income and a cheap-value re-rating. September retains the platform opportunity but makes Platforms mix, infrastructure spending, completed software acquisitions and leadership execution central to the business test. Changes in panel composition, reference prices and model methodology are separate from operational improvement.
The August H1 release raised full-year constant-currency growth guidance from February's 20–22% to 21–23%, including acquisition contributions. Underlying 2026 EBITDA margin is expected in line with 2025; acquisitions are expected to reduce the reported margin by approximately one percentage point. These are objectives and expectations, not full-year results.
Talon.One and Orb closed July 1, after the H1 accounting period. Talon.One supplies loyalty and promotions software; Orb supplies enterprise billing. H1 EUR6m transaction costs are separate from post-closing consolidation. Total consideration was EUR750m for Talon.One, including EUR69.80m Adyen shares, and USD335m for Orb, including USD33.20m shares. Different currencies and equity components must not be added as an all-cash euro amount. Hwa Tsao became full-time interim CFO September 1 following Ethan Tandowsky's departure; Gayathri Rajan became CPO effective July 1. Co-CEO Ingo Uytdehaage directs integration. The announced permanent-CFO search is separate from a verified subsequent appointment.
Our last public stock episode was Palantir, which also separated business quality from the price paid for distant growth. The companies' economics and forecasts differ. Listen to Palantir · Watch Palantir.
- What would weaken the bull case: disappointing organic growth, fee-yield losses without profitable volume, persistent investment without returns, integration disruption, or earnings increasingly dependent on finance income.
- What would weaken the bear case: durable merchant expansion, underlying EBITDA and post-tax cash quality while investment intensity moderates.
Companion conversations and what is next
- PayPal, Episode 11: distinguish client funds from corporate cash. Listen to PayPal · Watch PayPal.
- Apple, Episode 16: compare a consumer wallet/interface with the merchant acquiring layer. Listen to Apple · Watch Apple.
- Amazon, Episode 28: test what growing demand earns after investment. Listen to Amazon · Watch Amazon.
Adyen could compound substantial investor wealth if profitable growth and disciplined reinvestment support the dated targets. Explore the research, like, comment and subscribe. We are publishing a new podcast every day of the week except Thursday. Stay tuned for the next podcast on AXA.
Primary sources
- Adyen H1 2026 shareholder letter and financial statements — results, definitions, acquisitions, cash, guidance and dividend policy.
- Adyen H2 2025 shareholder letter and financial statements — the non-overlapping prior half-year for trailing earnings.
- Adyen 2025 annual report — annual measures and five-year EBITDA reconstruction.
- Official acquisition closings and leadership updates.
- Official Q3 2026 business-update event.
- iPulse AI methodology.
Primary research conducted through the iPulse AI platform by Future Edge Group.
Full Transcript
Reviewed 26 Oct 2026 · Complete selected 248-segment transcript and all 318 token-timed caption cues read by Codex AI parent, with whole-media decoding, source/numeric and sampled visual checks. No human, independent-agent or full uninterrupted listening/perfect aural verification claimed. Caption proper-name normalization is not phonetic proof. Upstream manual/source-display QA remains open; primary facts independently checked. Published RSS transcode full decoded correlation 0.9998324574036904 with zero lag. See package final-qa.json for documented limits. Select a timestamp to listen from that point. Download transcript
Full transcript · 30-second passages
Adyen stock. Will it make investors rich? The interesting question is how much lasting cash reaches shareholders after computing investment, acquisitions, and merchant settlement obligations. Welcome to AI Investment Edge, episode 31. Right out of the gate for you, let's just lay down the current evidence-weighted consensus rating. So for Adyen, it's actually a buy at both its one-year and five-year horizons. Okay. Got it. Yeah. And that comes with an immediate buy and keep platform
label. Now we check these ratings on October 26th using the October 23 price basis. Right. But, you know, we always have to remind everyone, these are platform research labels, right? Not personal trade commands. Exactly. Right. I mean, to have a real long-term thesis, you need both a sensible purchase valuation and, frankly, the company actually executing successfully. Yeah. Which is a big gift sometimes. So before we dive into the heavy math, let's just clarify what Adyen actually does because it's, well, it's kind of in the background of everything we do.
It really is. It's a Netherlands-based payments infrastructure company, mostly serving large merchants and software platforms. Basically, it seamlessly connects online and in-store payments, payment authorization, risk tools, acquiring, and settlement all through one single integrated platform. Which is huge for these massive global companies. Right. Merchants basically pay for processing and related services across three pillars, which are digital, unified commerce, and platforms. And, you know, while you might see their payment
terminals at a store, like that visible tip of the iceberg, the real value is their massive software and banking infrastructure. Yeah. That infrastructure layer is key. I mean, if you remember our previous Apple conversation on this show, we talked about how Apple offers the wallet, right? The actual device interface. Right. The part you tap. Exactly. Adyen is operating in a totally different layer. They provide the merchant acquiring plumbing underneath it all. So they don't compete with Apple. They just
coexist. Okay. So they're the plumbing. Let's look at how much water is actually flowing through those pipes. Because looking at the first half of 2026, their process payments were up 24% reported. That's about 804 billion euros. It's a massive number. It is. But then net revenue was only up 19% reported or 21% at constant currency, which is about 1.3 billion euros. Right. So wait, volume grew by 24%, but constant currency revenue only grew by
21%. Why is the volume growing faster than the revenue? Are they just, you know, losing their pricing power? So that is actually the massive debate right now. And we have to split this into two parts. First, it's a known fact that volume tiering and merchant mix contribute to a lower blended fee rate. Like a bulk discount. Precisely. When a huge, you know, non-exclusive global merchant, someone like a major streaming service or a rideshare company pushes billions through Adyen, they
get a cheaper per transaction rate. That makes sense. Yeah. So as that top tier volume explodes, the average revenue they squeeze out of each transaction naturally shrinks. That's just mix. But the second part is an open question. Which is what? How much does commercial pricing pressure also contribute to that lower yield? I mean, competitors are constantly trying to undercut them. And it's important to remember both of these things can coexist. It isn't just mix. But regardless of what's causing it, that 21% revenue growth has to remain profitable.
Okay. So let's talk about that profitability. Their first half EBITDA was around 642 million euros. That's a 49% margin. Right. But their actual operating margin is 43%. So where's that missing 6% going? Huh. So that gap is almost entirely depreciation and amortization. It's roughly 77 million euros. Just from wear and tear? Exactly. Wear and tear on their massive data centers and hardware. So if you take that 642 million in EBITDA and subtract the 77 million in
depreciation and amortization, you're left with about 564 million in actual operating profit. Got it. But they also have finance income boosting things, right? They do. Yeah. About 143 million euros in broad finance income. But, and this is crucial, notice where that sits on the income statement. It sits below both operating profit and EBITDA. So it juices the net earnings. Exactly. It boosts net earnings.
But you can't rely on it forever. And this is exactly why a management's long-term goal, which is hitting above 55% by 2028, that is specifically an EBITDA margin goal. Oh, interesting. Yeah. It is not a guaranteed operating margin outcome. Net earnings can really depend on that finance income, which fluctuates. Okay. Let's pivot to the balance sheet. Because they reported cash at June 30 of 12.4 billion euros, which sounds incredible.
But thinking back to our previous PayPal conversation on the show, we have to separate client funds from corporate cash, right? Yes. That is the exact same dynamic here. Out of that 12.4 billion, about 8.1 billion euros is owed directly to merchants. Wow. Okay. So it's not even theirs. Right. It is not shareholder cash. It's just sitting in the register waiting to be paid out. So if you adjust for that and factor in merchant receivables, it leaves them with about 4.9 billion euros in actual corporate cash. Okay. That's a big haircut from 12 billion.
Yeah. And if we look at it pro forma net of their recent acquisitions, it's roughly 4.6 billion euros. And what about liabilities? Well, their total current assets are roughly 14 billion euros and current liabilities are about 8.5 billion. So that gives them a current ratio of about 1.6. Which seems pretty healthy. It is, but you have to remember that lease obligations and strict regulatory capital requirements still remain. They can't just spend all of that cash freely. Speaking of spending, let's look at their investment intensity.
Their first half company defined CapEx was about 64 million euros. That's like 5% of net revenue. Right. But I saw their full year plan is around 7%. Why the sudden jump in the second half? Basically, management decided to pull forward some 2027 data center purchases. Into the second half of 2026. Oh, so they're front loading it. Exactly. Which, you know, brings up a good point. Kind of like our previous Amazon conversation.
Yeah. Where the heavy spending isn't inherently bad. As long as the demand pays off eventually. Right. The question isn't just about the spending itself. It's about what that growing demand actually earns after the heavy investment bill is paid. Management expects investment intensity to decline later on, but we have to treat that as an expectation to be tested. It's not a guaranteed end to costs. Exactly. So to test it, let's look at one clear cash bridge. Okay. Walk me through it. You start with that roughly 642 million in EBITDA.
You subtract the 64 million in CapEx and about 24 million in lease principal. Okay. And that leaves you with roughly 553 million euros in free cash before cash taxes and working capital movements. Wait, but their statutory operating cash flow was massive, right? Like 2.3 billion euros. Yes. And you definitely shouldn't ignore statutory cash flow. But you have to reconcile the movements. That 2.3 billion includes approximately 1.7 billion of merchant payable
settlement inflow. Oh, so again, that's just the merchant money sloshing around. Exactly. That settlement inflow is not shareholder cash. You have to strip it out to see what the business actually generated for investors. Okay. So with that real cash number in mind, let's talk valuation. To get the trailing 12-month profit, we just count each half once, right? Right. So second half of 2025 was roughly 582 million.
Plus the first half of 2026 at 544 million. That gives us a trailing profit of roughly 1.13 billion euros. Which, at the dated reference price, gives you a PE of roughly 27. A PE of 27. And for you listening, I really want to stress this. Do not fall for these AI narratives online. They keep repeating fake low teens multiples for Adyen. Yeah, that's a huge trap. Right. Because some of these models accidentally duplicate the semi-annual data, and it literally cuts the PE in half.
You have to use the real math. Yeah. A PE of 27 is the reality. So let's look at what that means for the actual stock price scenarios moving forward. Let's do it. And just to be clear, we are leading with the dated October 23 reference price of about 945 euros. So this is not a live Monday quote. Right. So assuming zero ordinary cash dividends at both horizons, our fixed endpoints are third quarter 2027 and third quarter 2031.
Okay. And what are the targets? The weighted base endpoint for 2027 is roughly 1,108 euros. Which is about 17% cumulative appreciation. Exactly. And for 2031, the base endpoint is about 2,193 euros, which implies roughly a 132% cumulative price appreciation. Okay. Those are serious numbers. What actually drives the bull and bear cases for those targets? Well, the bull case really requires them to sustain merchant expansion, drive useful
cross-selling, and crucially, that heavy investment intensity has to actually ease up. And the bear case? The bear case happens if we see weaker demand, rising infrastructure costs, lower interest income, and frankly, valuation compression. If the market just decides a PE of 27 is too expensive. Right. So looking at the practical market forces, the four quadrants, what are the ordinary drivers and frictions acting on this?
For ordinary drivers, it's about capturing more wallet share from existing merchants, deeper integration, and pushing more platforms flow. And the frictions? The frictions are the massive bargaining power of their large customers, heavy regulation, and just brutal competition. Okay. But what about the wild cards? Like the distinct upside tail? The distinct upside tail is super interesting. It's the idea of machine-to-machine and agent-directed commerce becoming a substantial new payment channel.
Like AI agents buying things on our behalf. Exactly. Or alternatively, a massive unexpected migration away from legacy systems. But, and this is a big but, this is a highly speculative scenario. It is not a confirmed contract. Got it. And what's the distinct downside tail? That would be a prolonged outage or a massive security breach of their integrated stack. Something that just shatters trust. Or a major shift to alternative payment rails that just bypasses them entirely.
Wow. Okay. But we need to keep those extreme conditional tails strictly separate from just ordinary business fluctuations. Absolutely. So, considering all these risks and rewards, where is the market actually mispricing, Adyen? Where is the alpha gap? The core research hypothesis here is that investors might be mistaking the lower blended payment basis points and that front-loaded investment for a permanently weakening business. So, it brings us right back to our earlier debate. We know the mix and tiering causes compression.
But the open question is how much actual pricing pressure exists. And because they coexist, the market might be misinterpreting it. Precisely. But the counter-argument is that the market is actually completely correct to demand a discount. You know, because of that pricing power risk, their sensitivity to rates, and the massive future spending they need to do. Do the AI models agree on this alpha gap? Definitely not. I mean, we have 14 AI research contributions spanning nine frameworks and
three models, and they fiercely disagree. What are they disagreeing on specifically? They disagree on how much of that fee compression is just mix versus actual pricing pressure. They disagree on whether the investment will actually moderate. And they disagree on how fast their software acquisitions will actually earn their cost. But even with all that disagreement, the public-weighted rating is still a buy in both horizons. Yes. But keep in mind, that is distinct from individual strong buy opinions. Right. So, what does the actual quarterly path look like to hit those 2027 targets?
So, the first forecast checkpoint in the fourth quarter, 2026, is actually about €920. Wait, really? That's roughly 2.7% below the current reference price. It dips first. Yeah, the models project a near-term dip as the market digests that heavy front-loaded CapEx. But that's followed by a first quarter 2027 recovery near €976. Okay. But again, these forecast windows are not confirmed company events.
Speaking of which, what are the actual real events we should be watching? Well, the very next confirmed event is their Q3 business update on October 28th. Which is just two days after we're recording this. So, obviously, we are not going to invent results. Right. Exactly. And after that, the full H2 results won't be out until February 2027. Okay. So, looking back a bit, how has this analysis shifted over the last few months? Like, comparing the prior batch of research to now?
It shifted a lot. The July view leaned heavily on expecting a harvest period after a ton of hiring, plus relying on interest income and a cheap value re-rating. And September? The September view refocuses entirely on the platforms mix, the higher near-term CapEx, software integration, and looking for actual proof of cash quality. Oh, so there were real business changes driving this, not just panel score changes. Yes, exactly. For instance, their August guidance actually raised their 2026 constant
currency growth to between 21 and 23 percent. That's a good sign. And they had some acquisitions too, right? Yeah, they closed on Talon.One for 750 million euros and Orb for 335 million US dollars. Oh, wow. Big deals. Yeah. And both of those closed on July 1, which means it was after the H1 period. Also, both deals included Adyen shares. And that 6 million euro expense we saw in H1, that was just transaction costs, not consolidated operations.
Got it. And there was some leadership shakeup too. Right. CPO Gayathri Rajan became effective July 1, and interim CFO Hwa Tsao became effective September 1. It's important to keep those dates separate. Definitely. Now, bringing up our last public stock baseline from episode 30, which was Palantir, the contrast here is crazy. Oh, completely different. Yeah. Palantir was a debate about an attractive software business versus the massive price paid for future growth. Adyen's payments economics and its capital requirements are just a completely
different animal. They require a totally different analytical lens. So wrap this up for us. What would prove this entire deep dive wrong? What's the invalidation? You should challenge the bull case if their organic growth disappoints, if fee yield falls without profitable volume to make up for it, or if net earnings rely too heavily on finance income. And to invalidate the bear case? Challenge the bear case if revenue growth, cash quality, and merchant expansion stay strong, while that investment intensity actually moderates like management says it
will. Right. So a conditional synthesis for you listening. Adyen could compound substantial investor wealth, but only if profitable commerce growth and disciplined reinvestment support the targets. It's all about execution and actual cash economics. It is not a guaranteed rising line, and it is definitely not a fabricated low multiple. That's exactly it. Well, we naturally invite you to inspect Adyen's AI consensus, the individual AI opinions, and the profile and fundamentals on iPulse AI.
And just to recap, we mentioned our own previous conversations on PayPal, Apple, and Amazon today, and we used Palantir as our last talk baseline. Please remember to like, comment, and subscribe. Thanks for tuning in. We are publishing a new podcast every day of the week, except Thursday. Stay tuned for the next podcast on AXA. How does an insurer turn underwriting and invested premiums into shareholder value?